Scrab provides three independent types of charts to analyze your company (or companies) in a slightly different way. Here is a quick summary of all available tools.
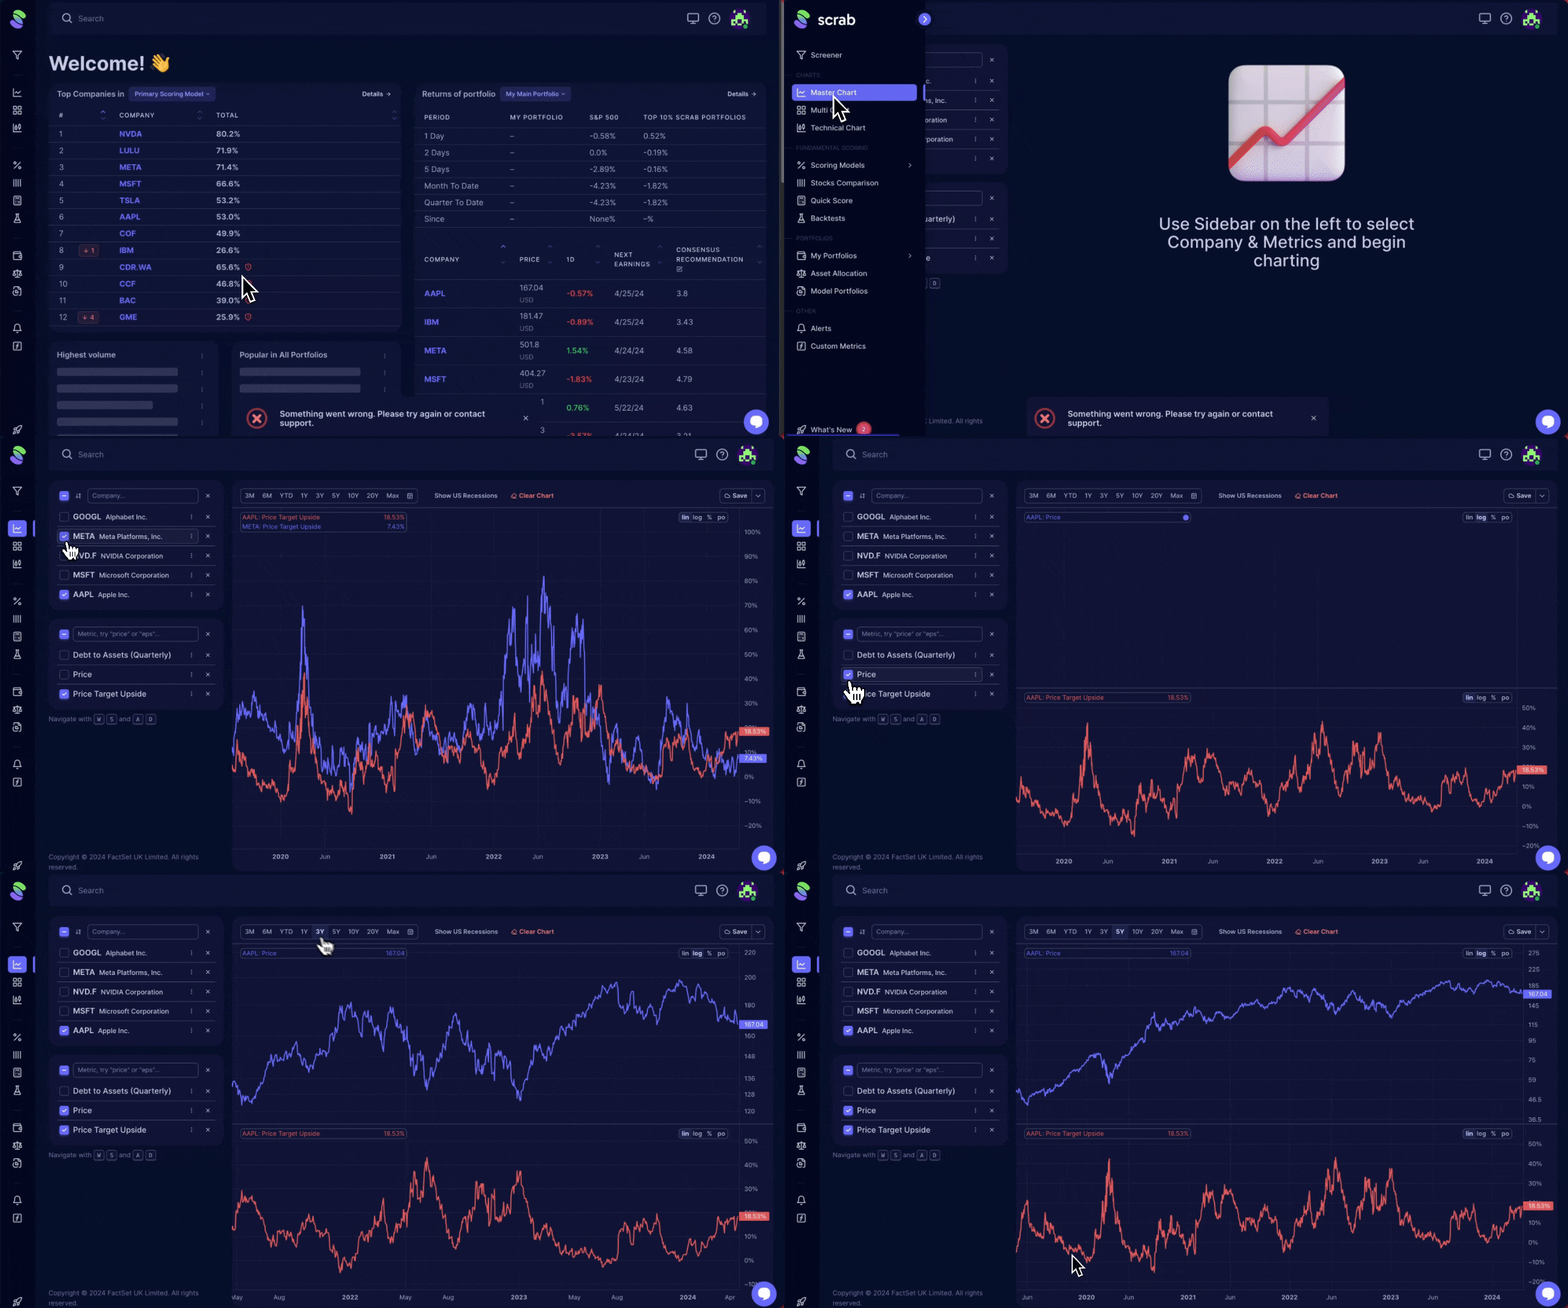
1. Master Chart
The Master Chart is your go-to resource for in-depth analysis of companies. It's the most detailed and flexible tool for visualizing financial and economic data. Whether comparing multiple companies or diving into a single company's financials, the Master Chart is ideal. It allows you to:
- Analyze a wide range of data from financial statements, such as revenue and debt levels.
- Explore various indicators like P/E ratios and Price Targets.
- View up to 500 different metrics to understand a company's fundamentals.
- Detect trends, find correlations between data series, and compare metrics across different companies.
- Access critical economic indicators, including the Consumer Price Index, Consumer Sentiment, and more, covering over 30 key metrics.
Use the Master Chart to comprehensively view market dynamics and refine your investment strategy with precise, data-driven insights.

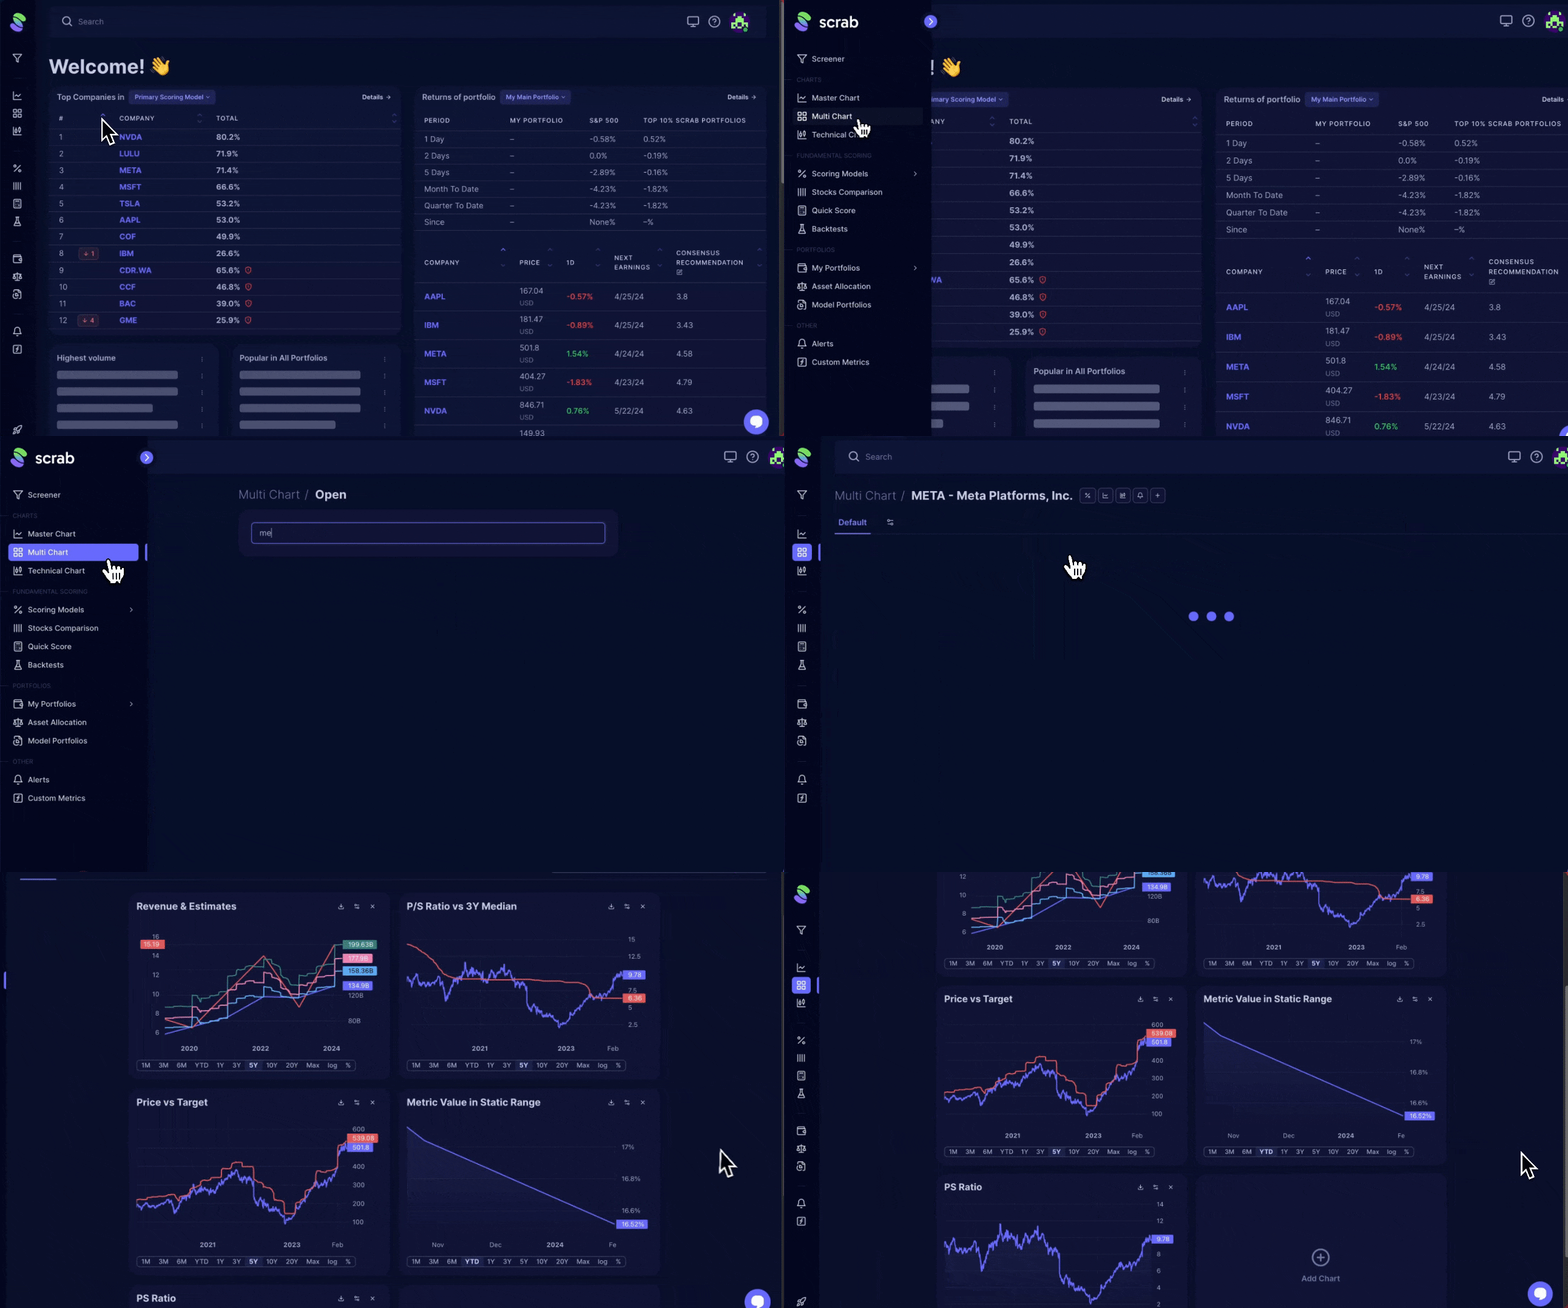
2. Multi Chart
The Multi Chart is perfect for a fast overview of your company’s health. It displays numerous mini charts simultaneously, each representing different metrics, which allows you to:
- Quickly assess changes in estimates and check if trends are holding steady or if potential returns are below expectations.
- Customize your view by adding more data series to any chart or grouping data into thematic tabs like "value" or "growth" for easy reference.
- Save customized settings and switch between them instantly, making your analysis speedy and efficient.
This tool simplifies complex data analysis, helping you make informed decisions faster by visualizing various metrics at once
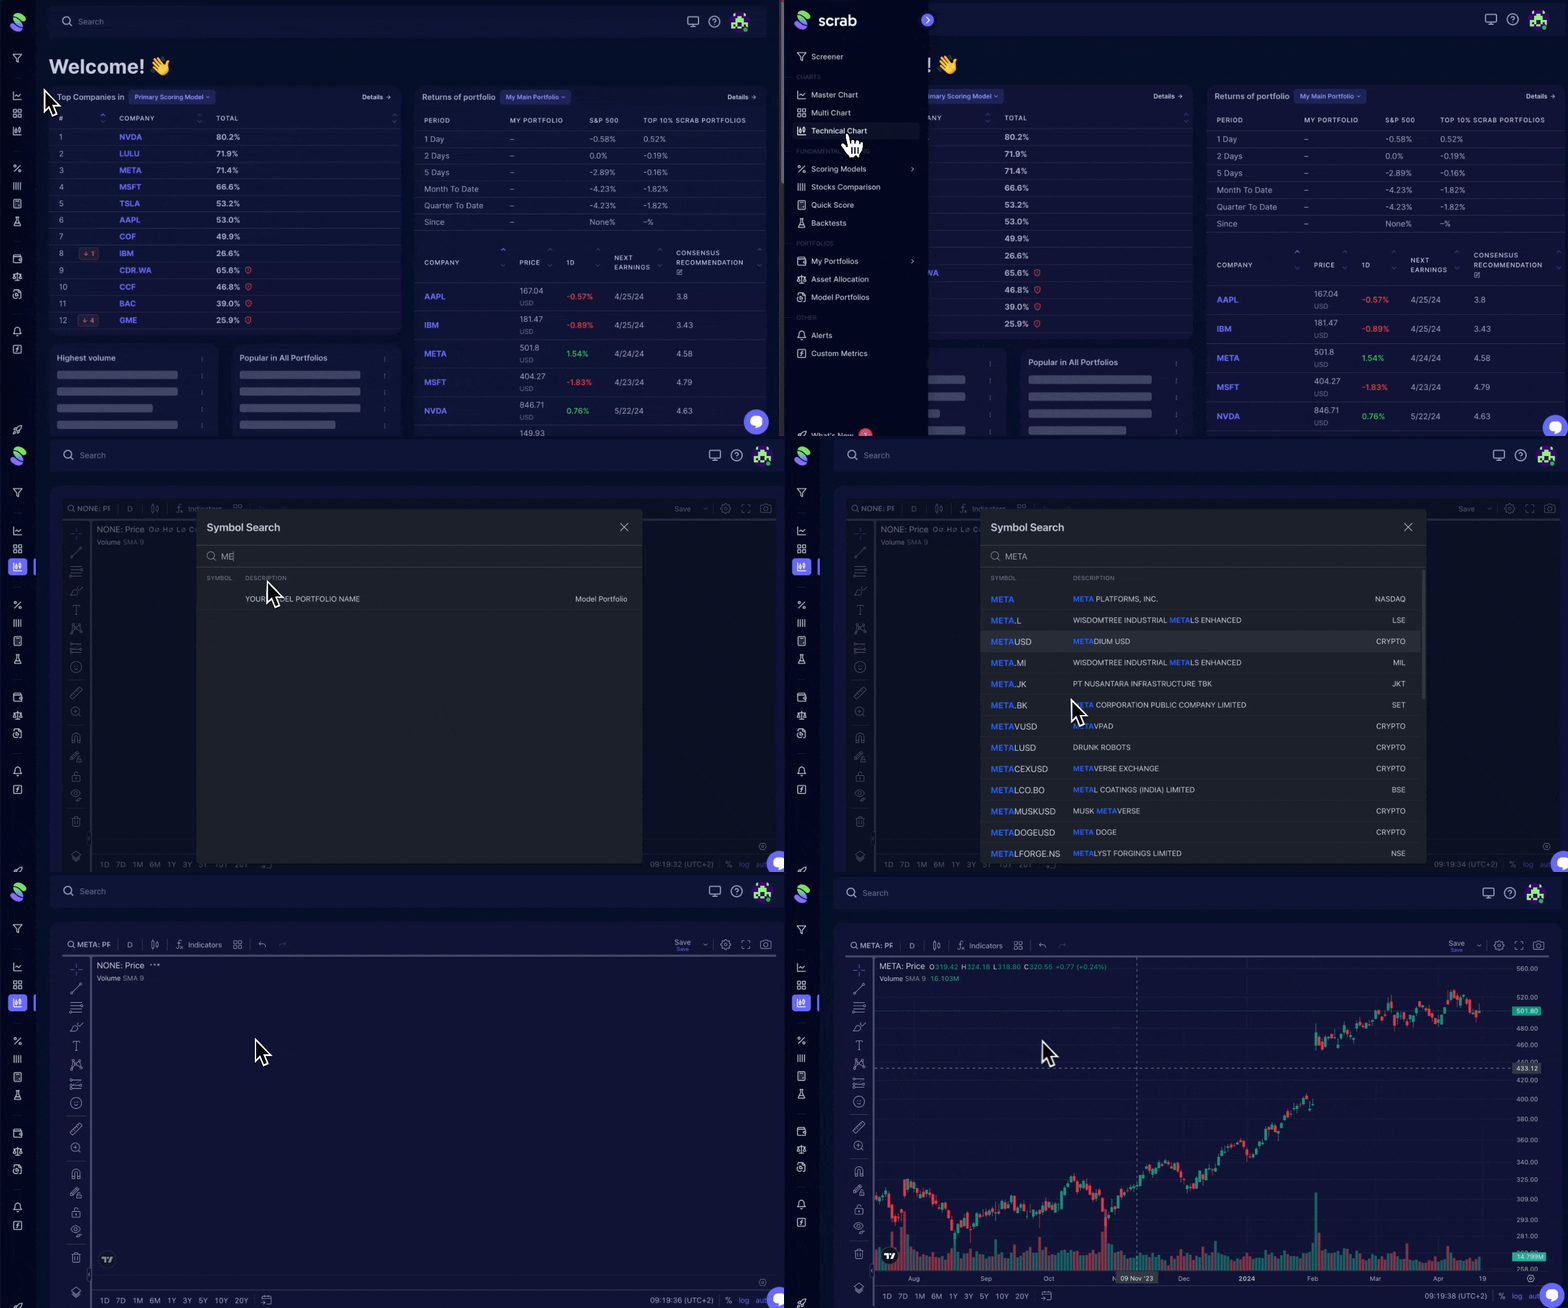
3. Technical Chart
Our technical chart is valuable for those who incorporate technical analysis into their investment strategy. It operates on the renowned TradingView engine, providing a familiar interface for those experienced with market charts.
While we don’t modify this tool, it seamlessly integrates into the Scrab ecosystem, allowing you to analyze stock patterns without switching platforms.
You can refer to the TradingView documentation to explore the full capabilities and features of the Technical Chart.


