

The Multi Chart option is in the Chart Categories of the left navigation panel. This feature lets you view multiple metrics for one or more companies quickly. It's faster but less detailed than using the Master Chart.
However, without opening each indicator separately, a well-set-up Multi Chart is perfect for swiftly reviewing a company's essential data, such as fundamentals, growth metrics, or valuation.
Setting up a Multi Chart
Once inside multi-chart, enter the company name or stock ticker to pull up the charts.
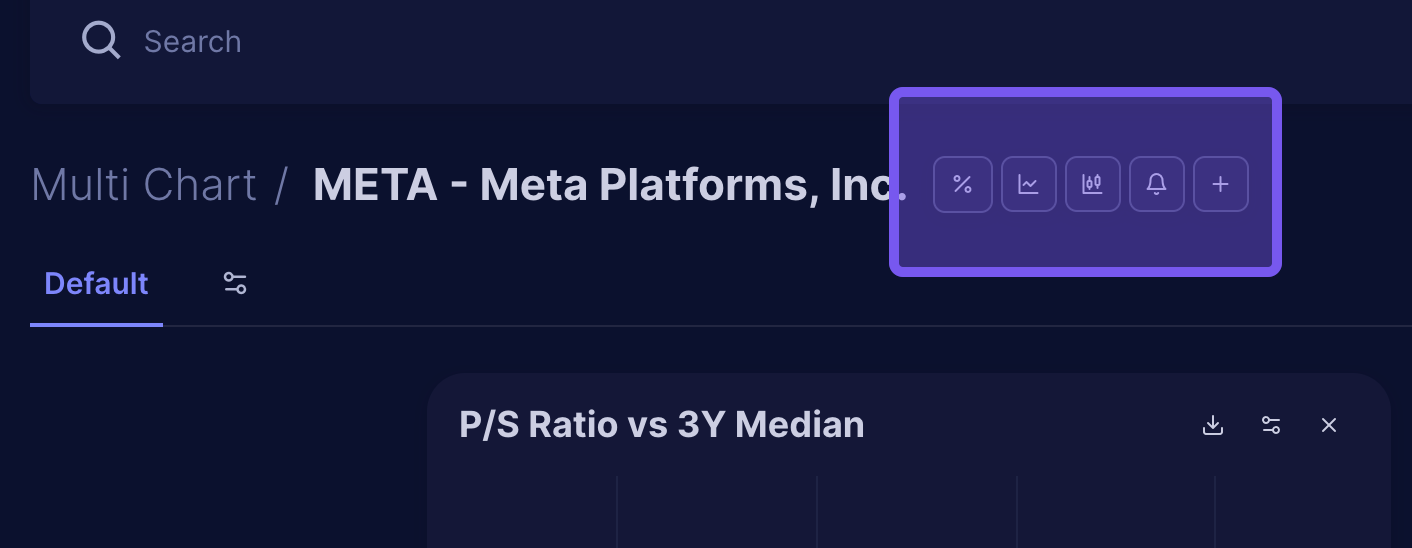
As with most common settings within Scrab, you can open the selected company and view its details, visualize it with other chart tools, set up an alert, or add it to a portfolio or scoring model.
As you view the Multi charts, we've included a few preconfigured metrics, such as Revenue and estimates, P/S Ratio vs. 3Y Median, Price vs. Target, and Metric Value in Static Range.
- To configure each individual chart, you have 3 options:
- Download the chart as a PNG file.
- Search and Select or deselect the metrics you are interested in.
- Delete the individual chart.
- If you want an additional chart, scroll down and press the '+ Add Chart' button. Name/title your new chart and select the metric(s) you want to view, then 'Save'.
To view data for a different company, simply type its name in the search bar to access its details page, then click the Multi-Chart button.
Once in the Multi-Chart view, use the date toggle to select the time frame you want to see.
To adjust how you view the charts, click the horizon or maximize buttons to switch between different views.
Chart Groups
We've provided this option if you'd rather configure your multi charts into Metric Categories like Growth, Value, Fundamentals, etc.
To do so, click the 'Manage Groups' button and then ' + Add Chart.' Fill out the appropriate fields and choose the metric(s) you'd like to view in the individual chart, then 'Save.'
You can move each group around, or if you'd like to remove a group, you can do so by clicking the 'Manage Groups' button and then deleting it.
Something To Consider
When comparing data between companies on the Multi-Chart, focusing on one indicator at a time is most effective in avoiding clutter. Trying to compare multiple indicators for two companies on a single chart can lead to confusion. Learn more about this in our guide on using Multi-Chart for company comparisons.