
There are a few additional semi-advanced options and tools that you might want to apply to your company list in any scoring model. You can find them in the upper right corner:
First, you have the Filter icon, which allows you to... apply filters to the results. This is similar to the filters option you may already know from the Screener tool, so please refer to this manual if you want to know more about how to use it.
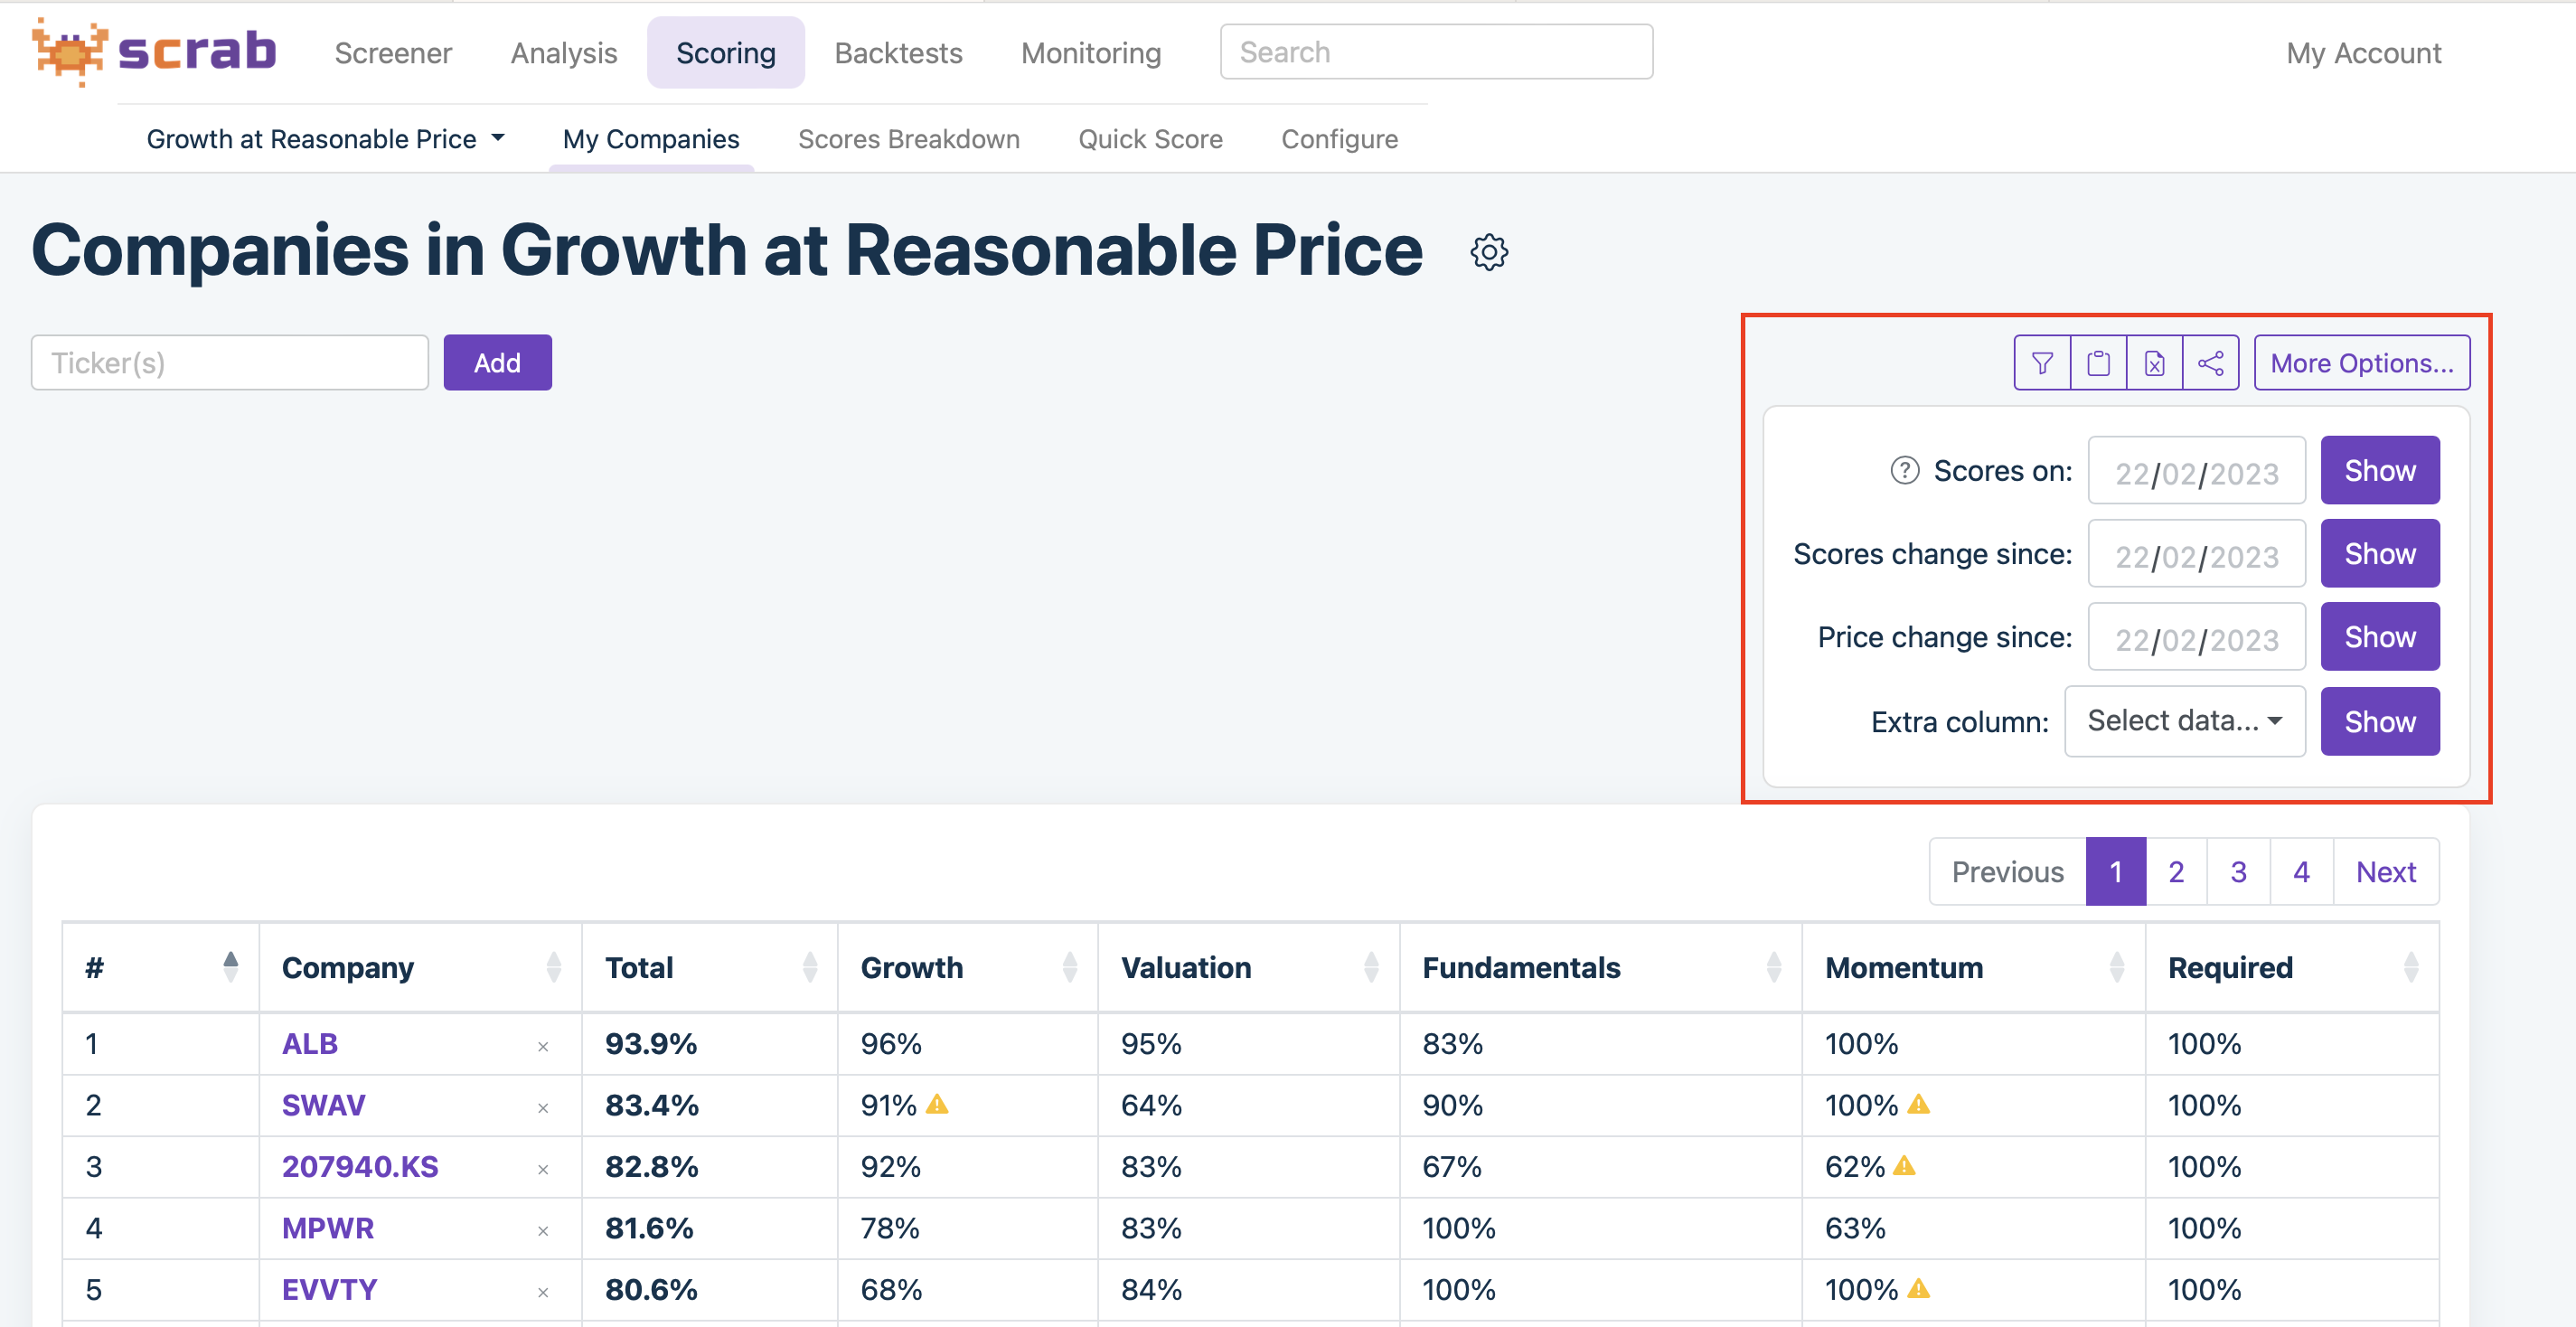
The next tools allow you to Copy the results to the clipboard, Export them to an Excel file or Share them as a PNG file, a link, or as an HTML code you can embed elsewhere.
The more important tools, though, are hidden under the button "More Options".
Scores on let you move back in time to see how the scores of your companies had looked like in the past.
The other way to see this is to apply the second option, which is Scores change since, and allows you to see the change in scoring in the percentage point terms. Thanks to that, you can compare the model's accuracy by applying the third option, that is, Price change since, and look at the correlation between score changes and price changes.
The last option, Extra column, gives you the opportunity to display one more additional indicator.