After running your backtest, you'll be redirected to your backtest results dashboard.
At the top of the Dashboard, you can see your original Backtest criteria, and you can always modify these settings by clicking 'Modify' at the top. You can also find the 'Tear Sheet' button in this section. This helps you further analyze your performance and compare your results to your desired benchmark. Read more about it since it's extremely useful in interpreting your strategy: Using Tear Sheet to analyze the performance.
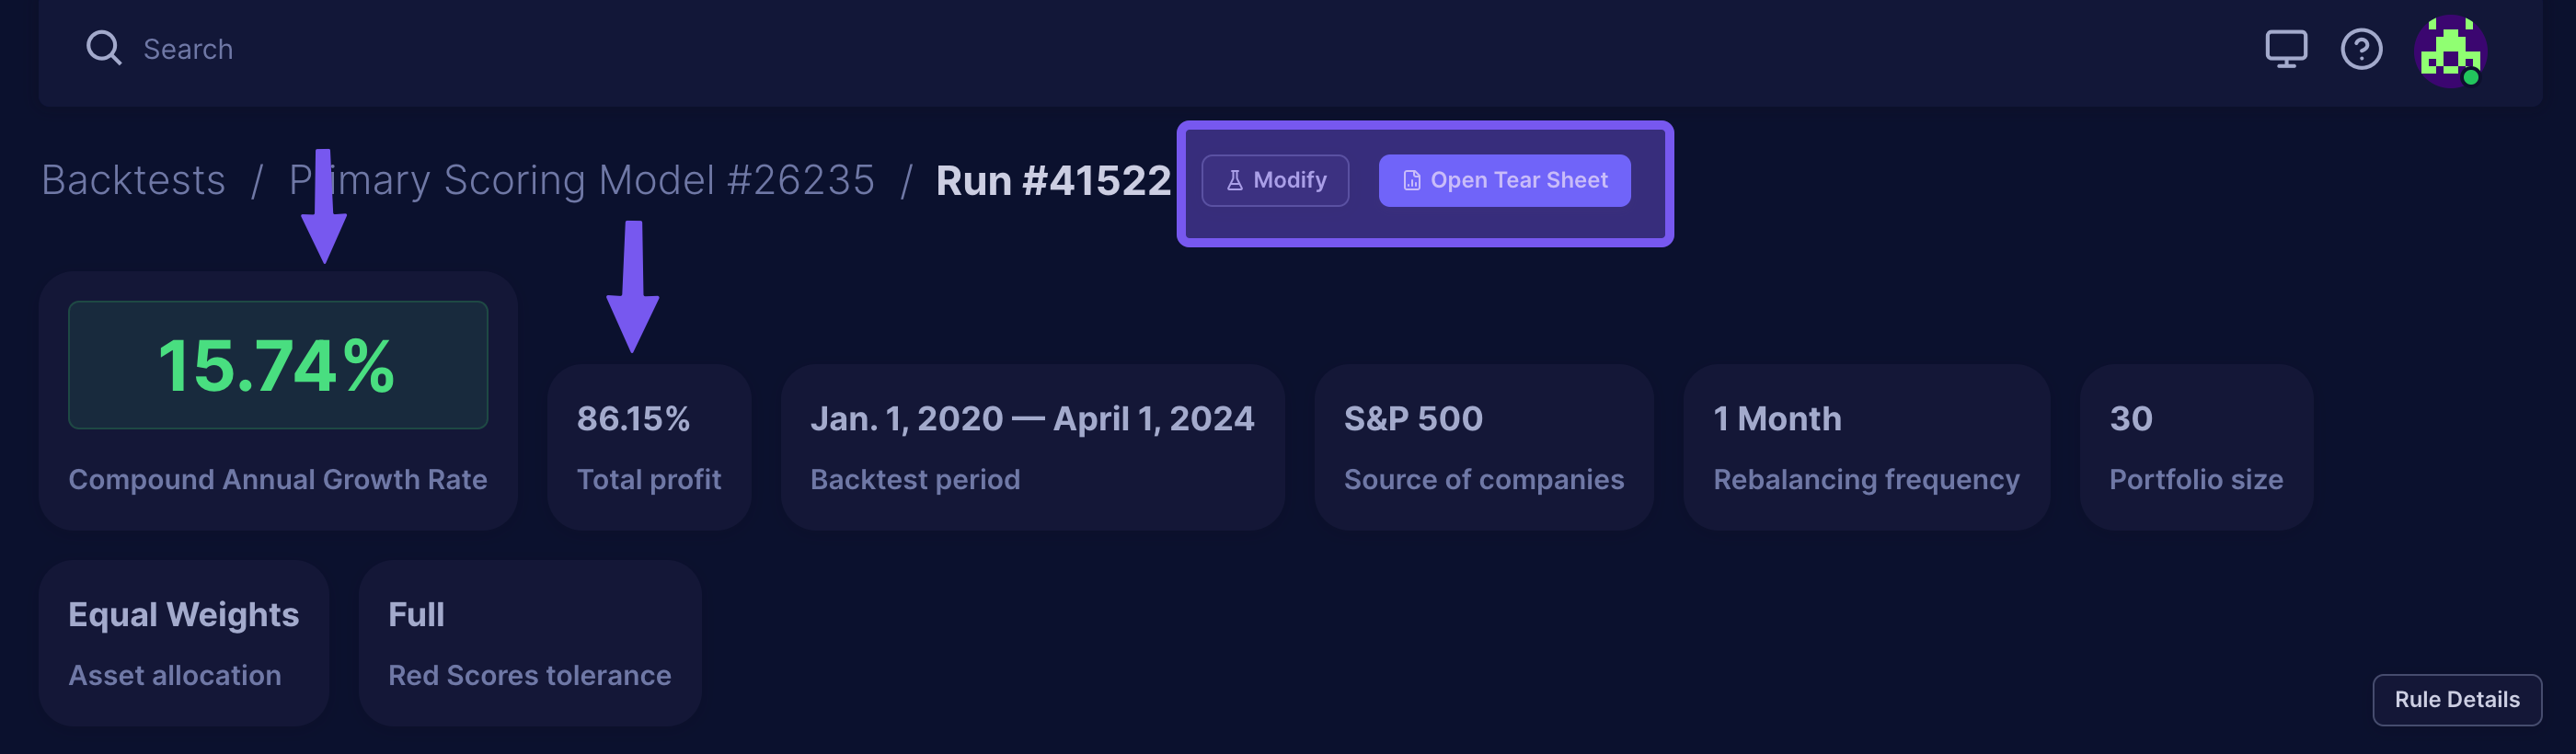
We also include 2 additional metrics you can use to interpret your backtest results:
- Compounded Annual Growth Rate (CAGR calculates the yearly growth of your investments, considering reinvested earnings' compounding effect. It's a theoretical average, useful for comparing strategies or portfolios, but not a precise prediction of yearly returns.
- Total Profit is a more "real" money-based indication of how much your portfolio would have grown if you were using this strategy.
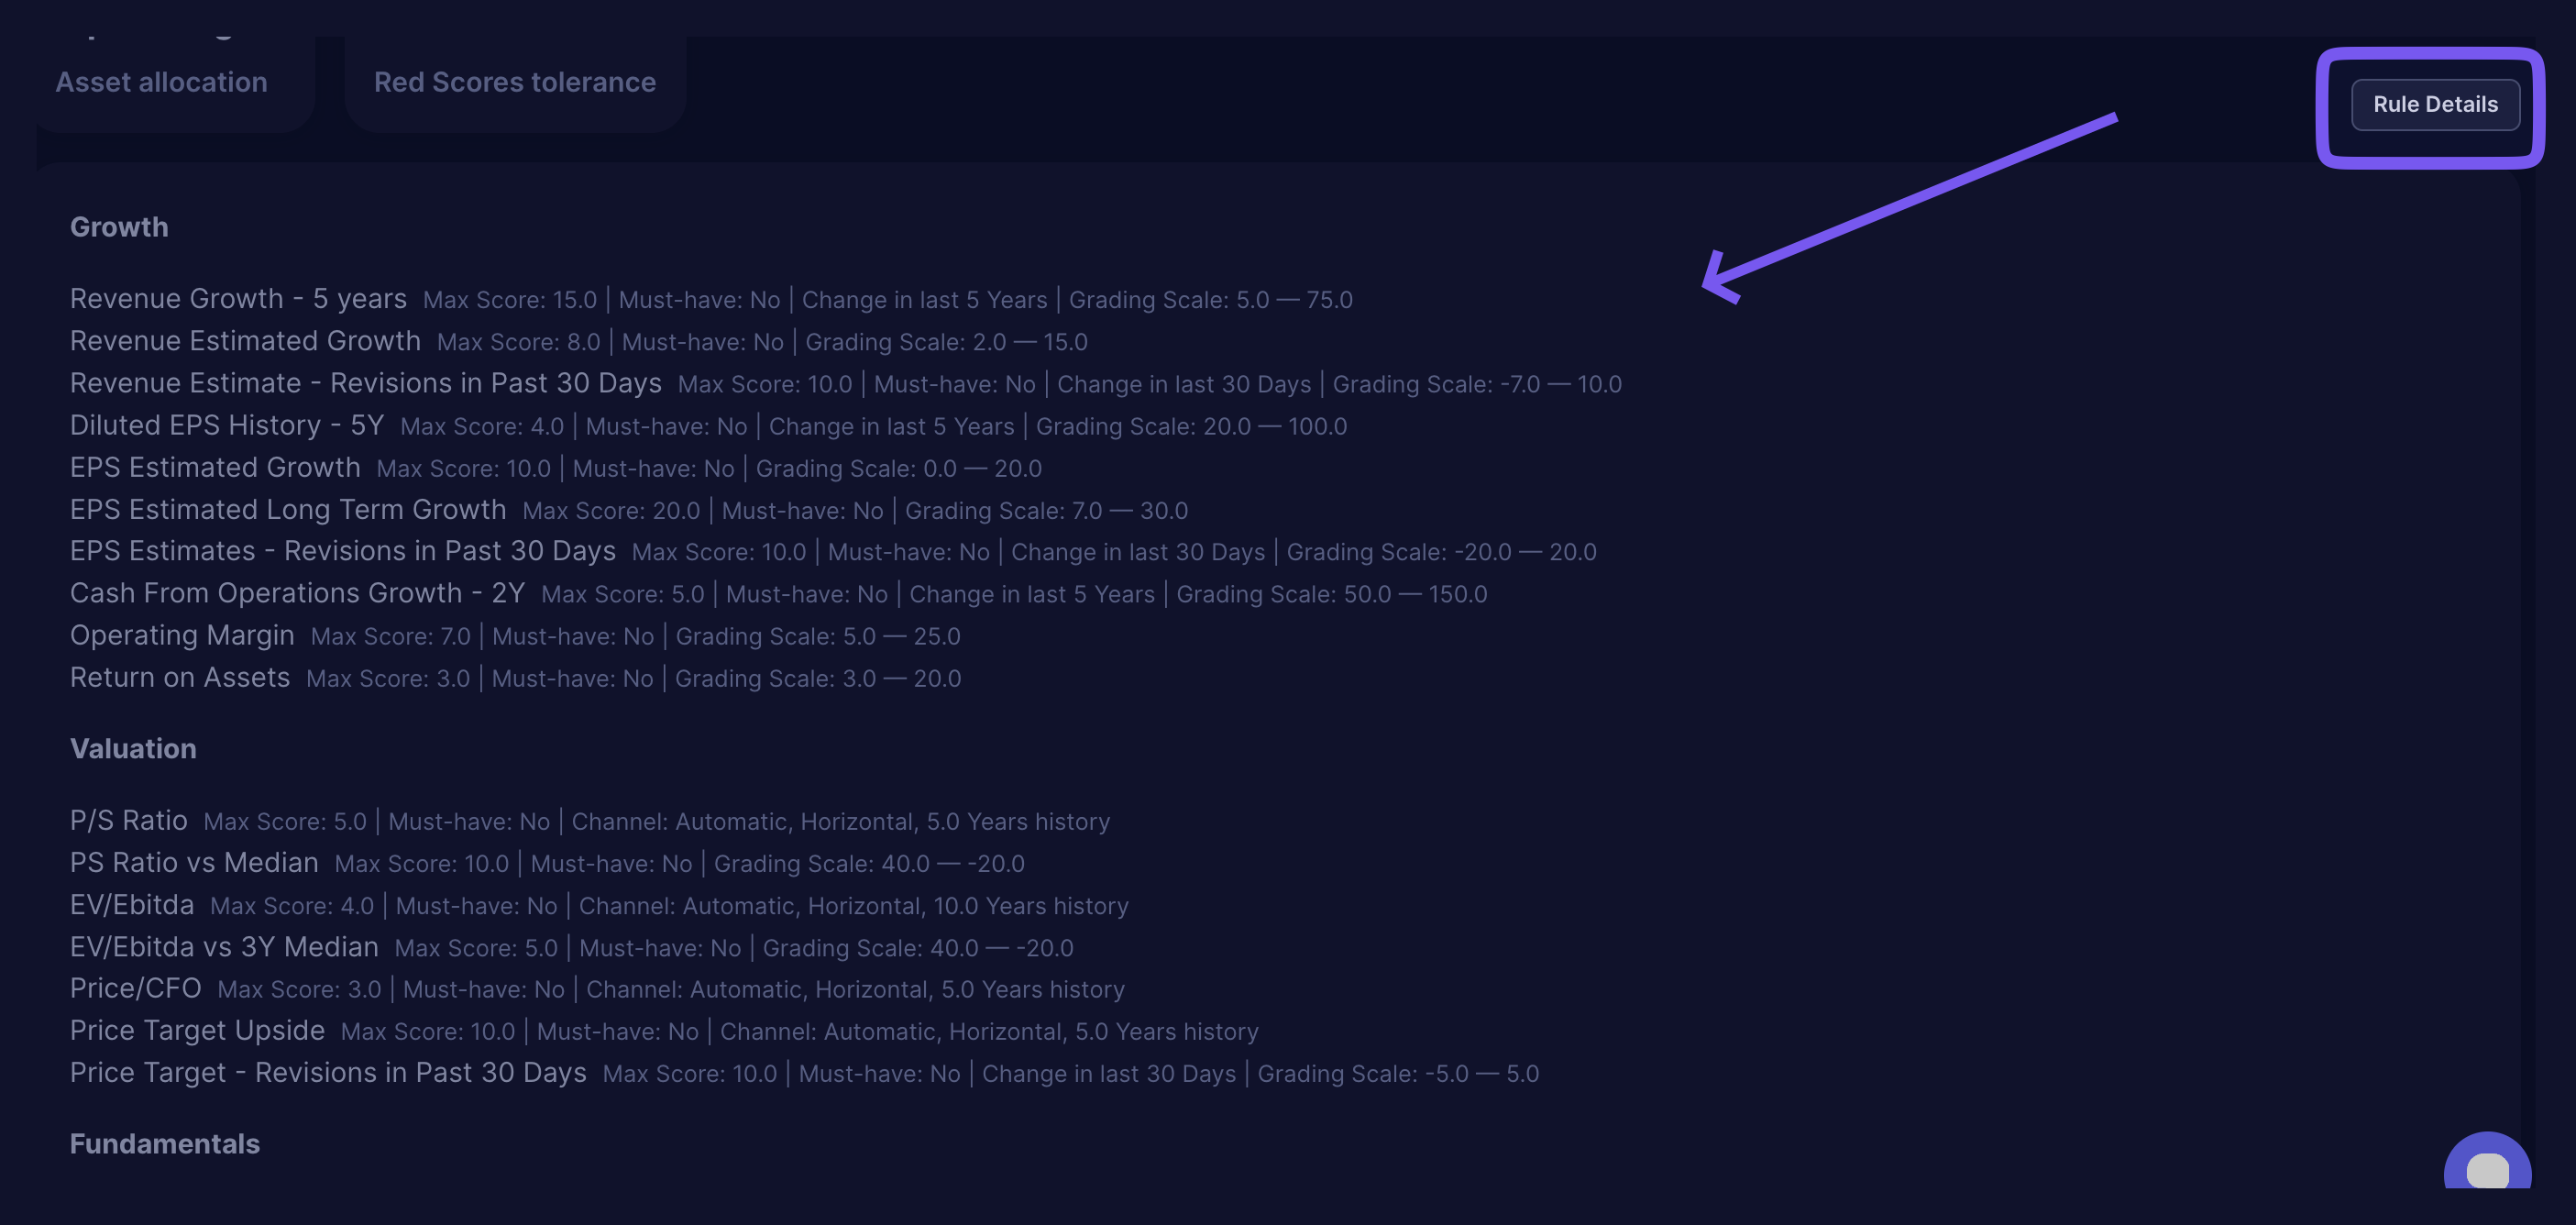
If you're curious to see the details of the strategy applied to the backtest, you can click on the Rule Details button. To collapse the Rule details, click the button again.
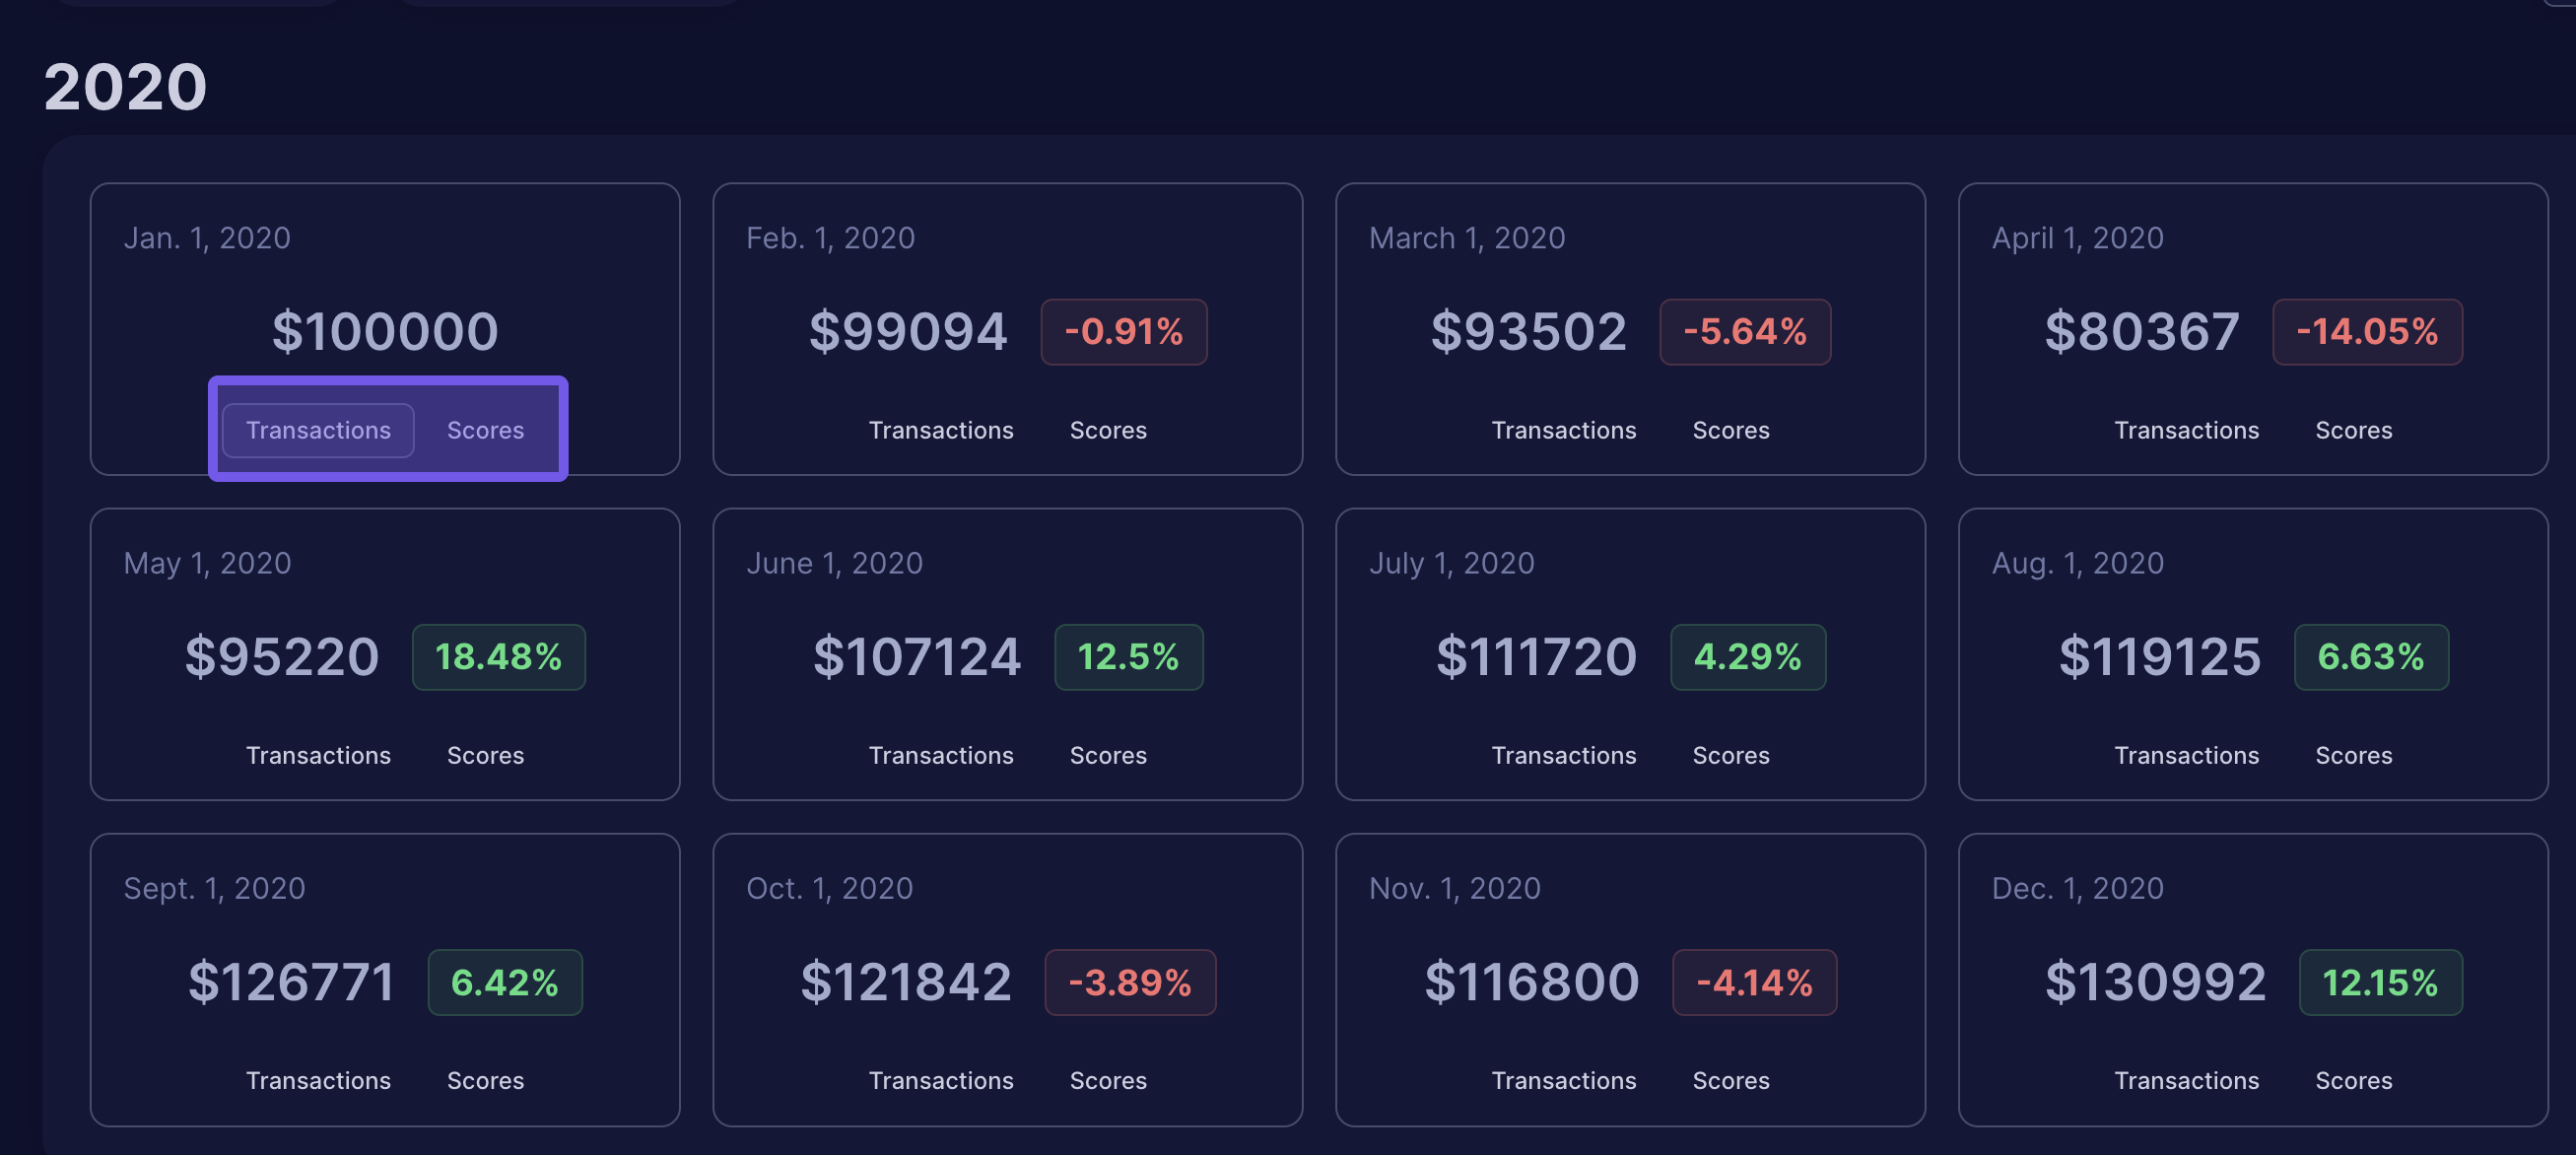
As you scroll through the page, we've set the view to show you each year's results. To view more detailed information, you can click on the following:
- Transactions – This shows you exactly how your positions would have looked if you were trading them back then.
- Scores– This will open a new tab to view the exact historical scores (current scores back then) of the TOP companies you were supposed to buy during each rebalancing period.
- Once the new tab opens, you can filter, copy the score or download into an excel file.