Setting up a new scoring model
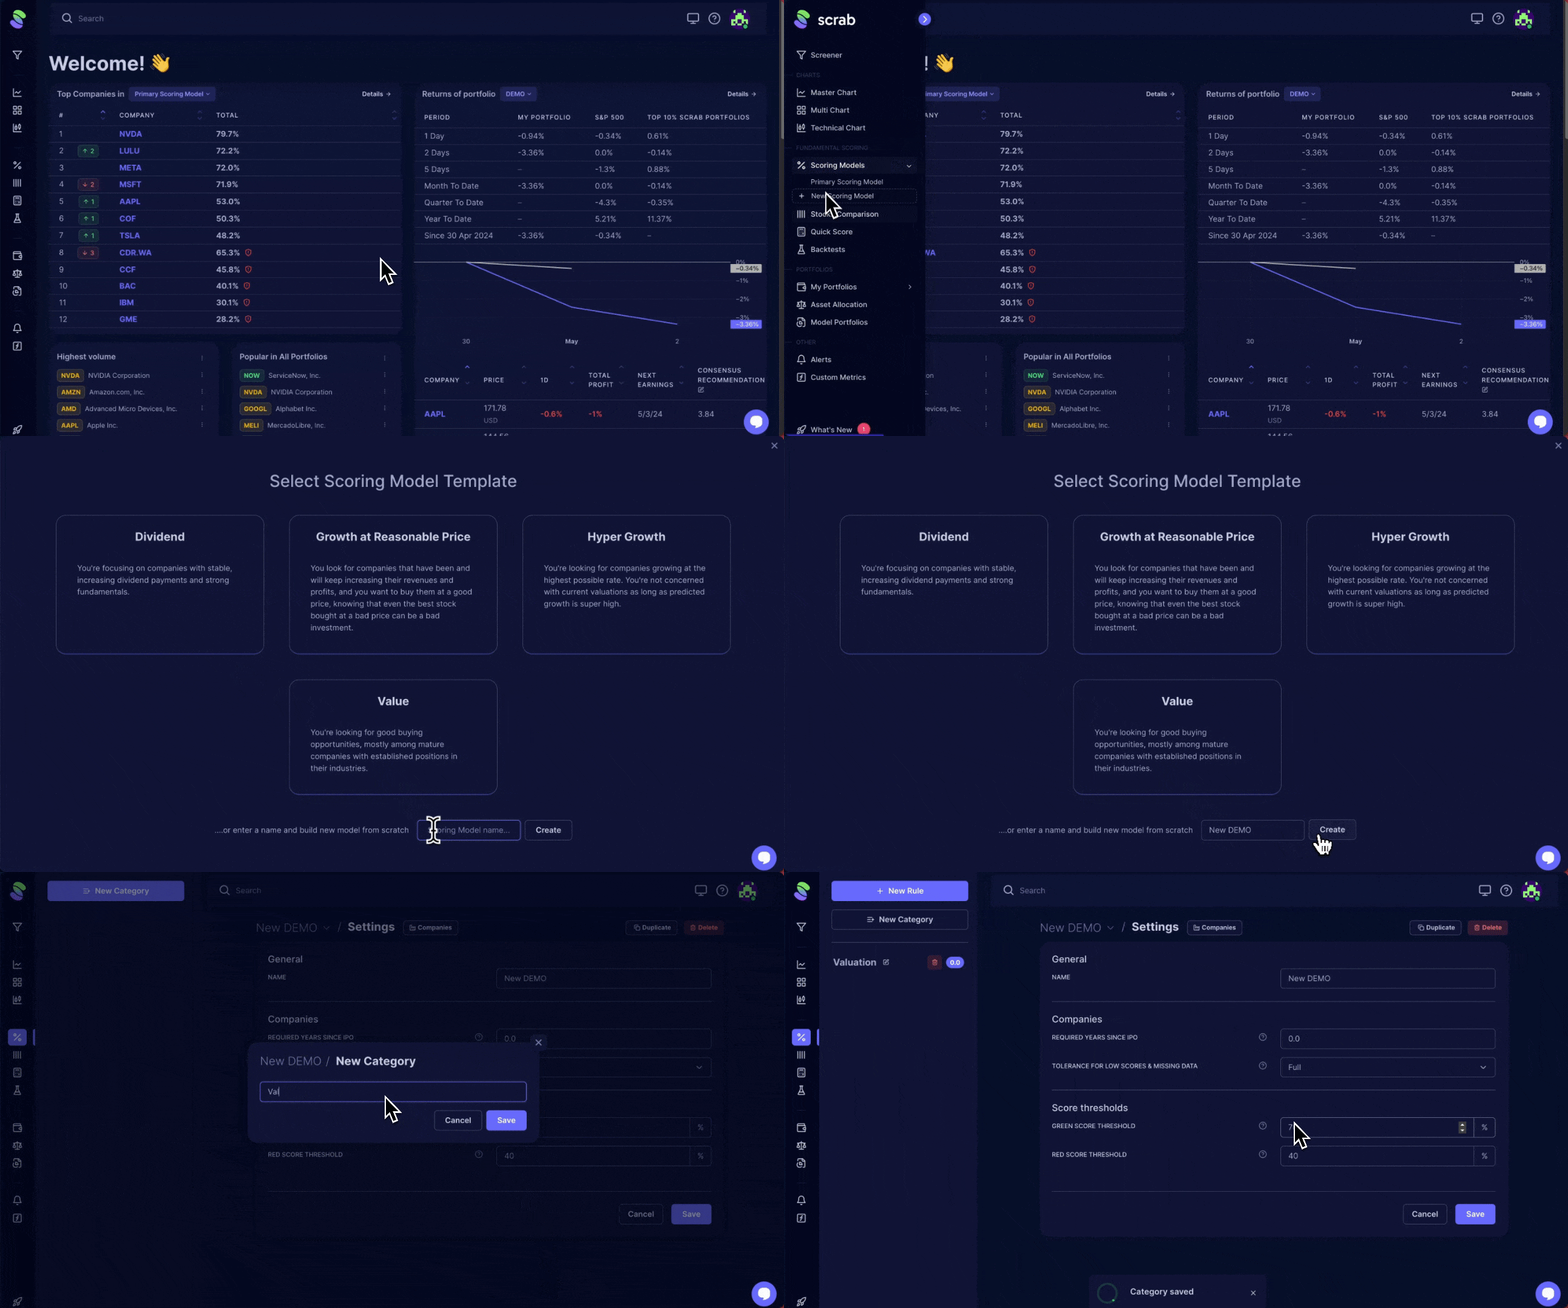
To start, use the left navigation pane, navigate to the Fundamental Scoring category, and click on the option' + New Scoring Model.' This will take you to a new screen.
From here, enter the name for your new scoring model at the bottom of the page, then click 'Create.' After selecting this option, a new window will open, asking you to create your first Rule Category.
These categories organize your metric rules based on a common theme. (i.e., value, growth, momentum, etc.). For instance, metrics like P/S Ratio, PS Ratio VS Median, and Price Target Upside could belong to a category named Valuation. Choose a category name that helps you grasp the overall score for that category.
Scoring Model Advanced Settings
When creating your own model from scratch, you have a few advanced settings to configure:
- Required years since IPO
- Tolerance for low scores and missing data
- Green(high) and red (low) score thresholds
For our example, set the required IPO years to 5, then click Save. The remaining settings we'll leave as is. Your view should look like the figure below: 
We've created a separate article with additional details to explain each setting for scoring models and how they can be used. Click here to read.
Metric Rules
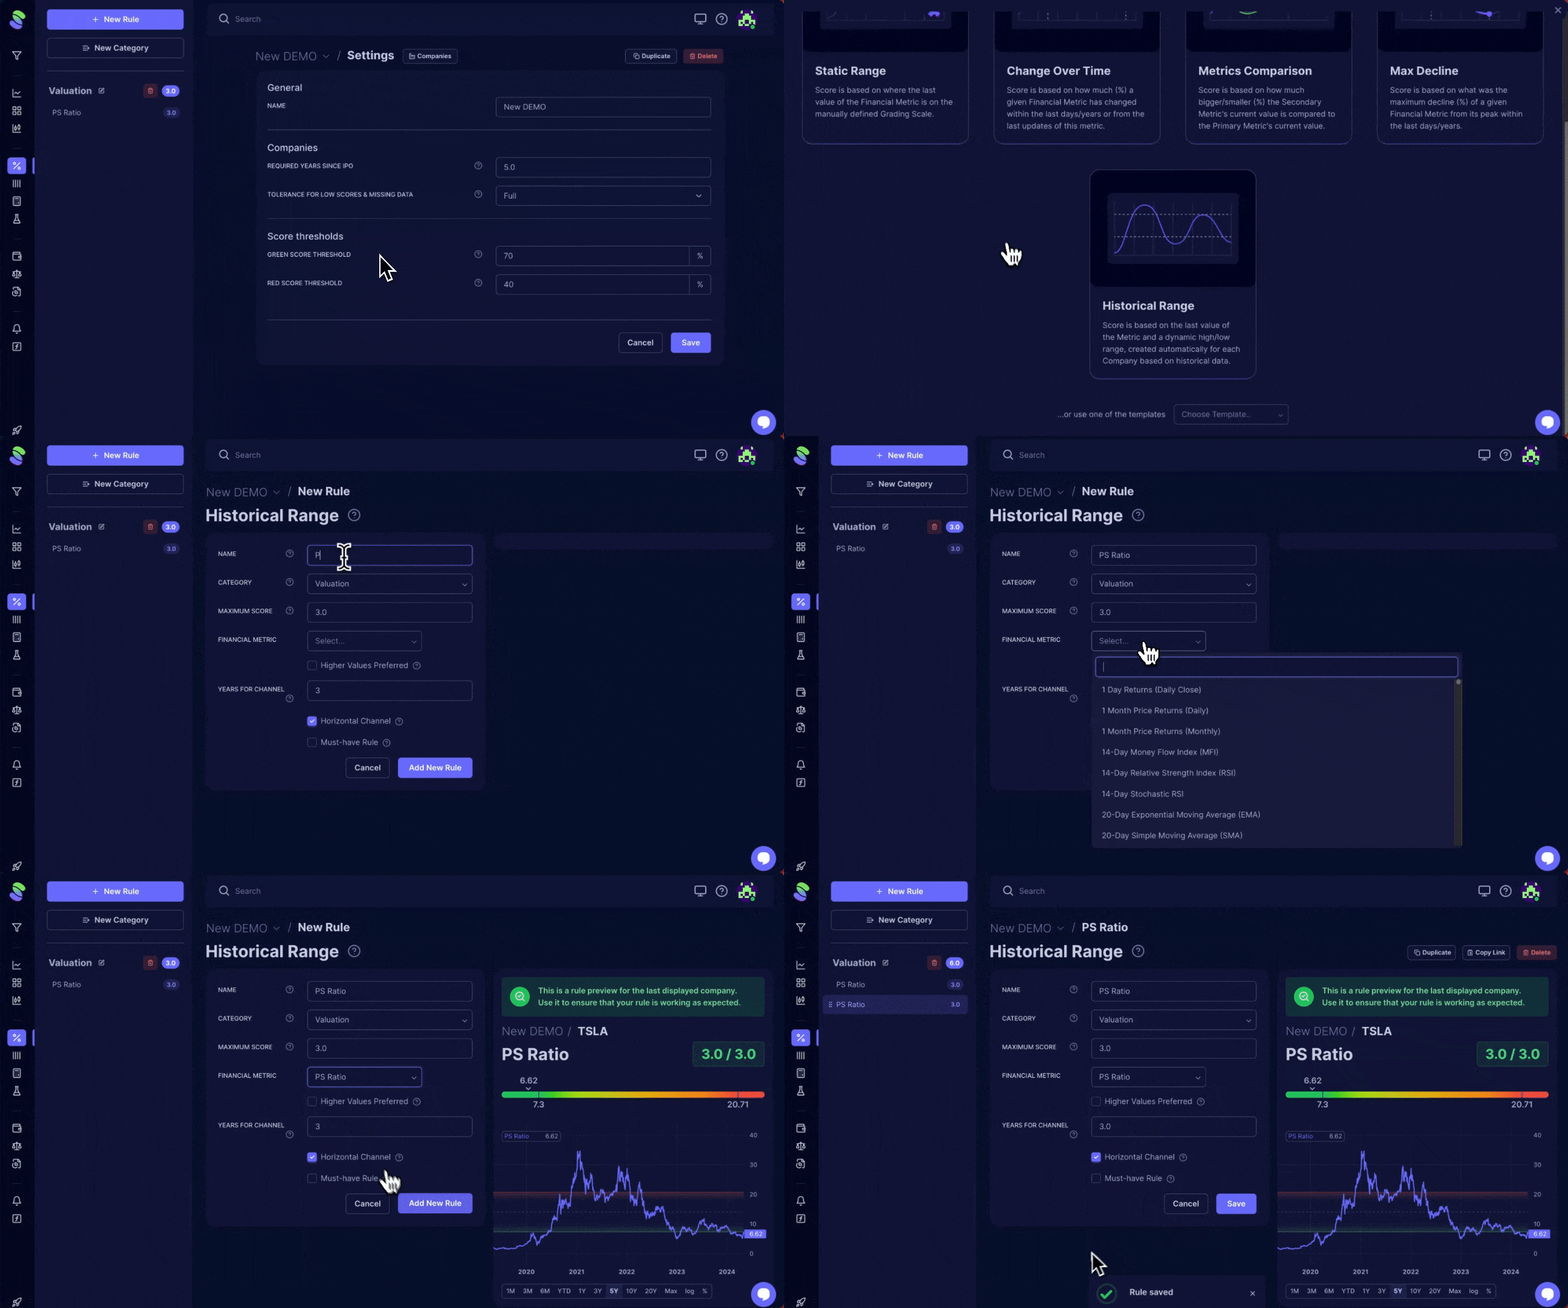
The next step is to add our first rule to the model. To add a new Rule while still in your Scoring Model, click 'New Rule' at the top left.
We have five different types of rules to choose from and the option of choosing pre-set rules. Each is unique and serves a different purpose.
- Static Range: Select this option to determine whether a specific metric's value is high or low compared to a defined static range. Use it for metrics like Debt-to-Assets, Current Ratio, or Return on Invested Capital, where desired levels are generally stable across companies.
- Change Over Time: Assess how much a metric has changed over time in percentage values. Use it to analyze Revenue, EPS, Cash growth, or the magnitude of revisions for metrics like EPS or Revenue Estimates.
- Metrics Comparison: This approach compares a metric to another metric rather than a static or dynamic range. For example, it can be used to compare current P/S with its median from the last five years.
- Historical Range: This option is similar to the previous one, but the range is unique for each stock and calculated based on historical data. Use it for metrics like P/S, EV/EBITDA, or Upside, where the attractiveness depends on the company's situation and industry.
- Max Decline: This option is similar to the previous one but starts from the last peak instead of a single past point. It can be used to gauge the percentage decline of metrics like Stock Price, Price Target, EPS Estimates, Total Debt, etc.
- Pre-Configured Rules: These are real rules used by our users or us, which you can use as they are or modify further. Refer to this article for more: Configuring Rule Type Settings
For a detailed description of these rules types with examples, refer to this article: Scrab's Rule Types.
For our example, let's choose the Historical Range rule type. This will take you to the Historical Range rule settings.
- Let's name our rule 'PS Ratio'
- Choose the financial metric using the same name. (After you add the financial metric, Scrab displays previews of the rule.)
- Let's leave the maximum score at 3. This lets Scrab know that 3 is the highest possible points this rule can get.**
- Leave Higher Values Prefered unchecked, Years for the channel at 3, keep Horizontal Channel check, and leave must-have rule unchecked.**
- Click save to add the new rule.
- The rule you've just added is now under the 'Valuation' rule category.
To add a new rule category, click the new category button, name it, and save. Repeat the previous steps until you have all the categories and metric rules you want.
**To best understand how to configure each rule type, please read: Configuring Rule Type Settings
Add Companies
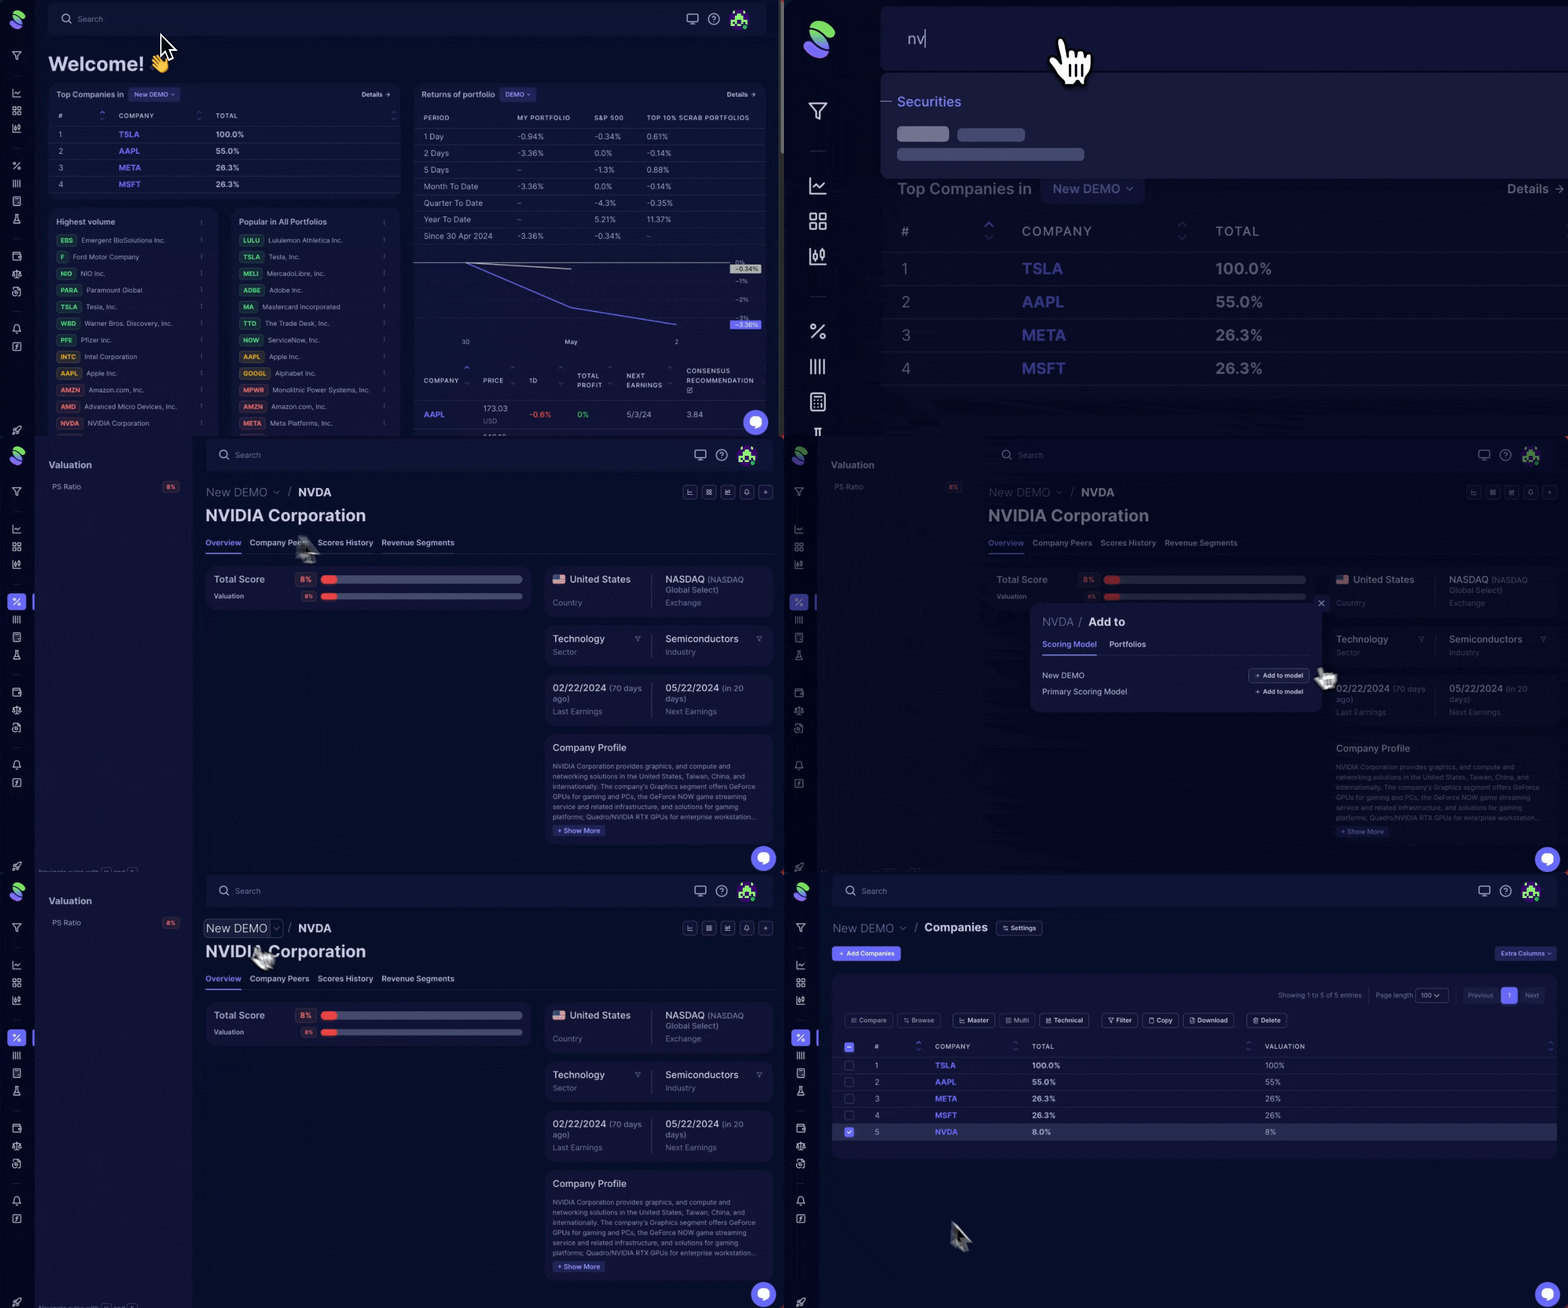
Now that you've created your first rule, you can add companies for Scrab to score for you. To add companies:
- If you're not in the Scoring Model Settings view, click on your scoring model name to go to the settings.
- Then, at the top middle, click the 'Companies' button. This will take you to your scoring model's company list view.
- Click ' Add Companies ' at the top left corner and enter the company tickers you want to add. Separate each ticker with a comma.
- Press enter once you typed out all the tickers.
- The companies are now part of your scoring model and have automatically been scored by Scrab based on the rule we've just added.

You can also add new companies to a scoring model as you find them. Add them from their Company Details page, or use Scrab's Screener to add more companies all at once!

Related articles
- To add more rules you designed, read the rest of the manuals in the Scoring Model section.
- To use one of our predefined ready-to-go scoring models, please refer to this article.


