

Configuring Scrab's different rule types is relatively easy, as all 5 rules share certain core elements and have their unique settings.
Shared settings
- Category and Rule Name: Each scoring model has rule categories that house your chosen metrics rules. You can name both rule categories and metric rule names as you wish. We recommend choosing names that will be easy to understand when you review your scoring results later.
- Maximum Score: The maximum score tells Scrab the highest score a company can get, based on your preference. This will help you determine which companies are doing well and which are underperforming based on what matters most to you. You can set different maximum scores when one rule may be more important than others. For example, if you are more conscious about debt levels than revenue, you'd want to choose a higher maximum score for your debt rule so Scrab can assign a higher weight.
- Grading Scale: Set your benchmarks for a high or low metric score with a 'Grading Scale.' This is how you decide and let Scrab know each metric's best and worst score thresholds. If a company hits the highest score when it exceeds your 'Best' mark, Scrab will award it the highest maximum score, but if it's zero, it falls to your 'Worst.' Points for scores in the middle are assigned based on their closeness to these thresholds within your grading scale.
- Must-have Rule: This setting designates a rule as critical, meaning a company not scoring at least 0.01 above the set threshold is drastically lowered in ranking, regardless of its scores in other areas. We recommend using it sparingly and primarily to exclude companies that do not meet essential criteria. These can be companies with low market caps or stocks under $5. This ensures only companies meeting your most important standards are considered.
Let's now look into each rule's unique settings.
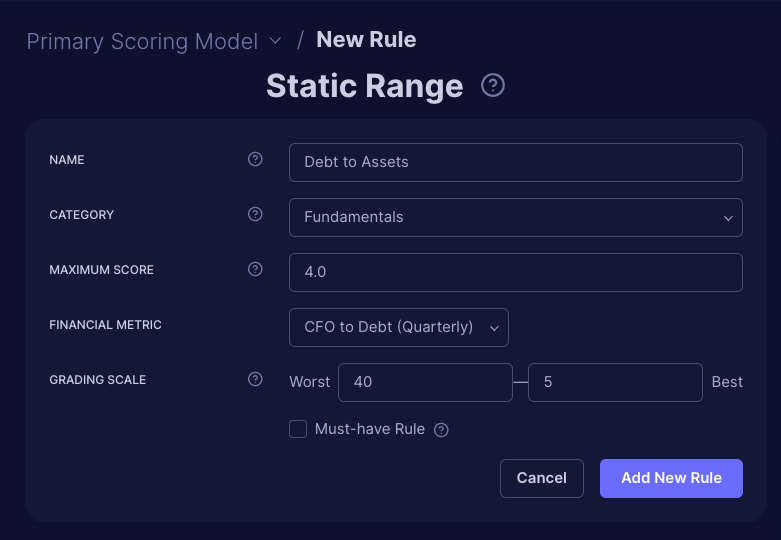
Static Range
The unique setting for this rule is that you need to change the Worst and Best to match the metric you are scoring. In our Debt-to-Assets ratio example below, a lower debt level relative to assets indicates a healthier company, prompting us to set the best scenario at 5% or lower and the worst at 40% or more.
For metrics like Return on Invested Capital (ROIC) or Operating Margin, where higher values are preferred, we'd set the thresholds differently, such as 'Worst = 5%, Best = 40%', to reflect that higher percentages indicate better performance.
Historical Range
The Historical Range rule adjusts to each stock uniquely by automatically calculating its highs and lows from historical data, allowing for dynamic ranges.
There are 3 unique settings for this rule type:
- Higher Values Preferred—Indicate if a higher metric value should earn more points. For metrics where a lower figure signals value, like the P/S ratio, uncheck it to prioritize lower values. Conversely, for metrics where a higher value is advantageous, such as stock upside potential, check it to award maximum points for higher figures.
- Years for Channel—With this, Scrab uses historical data to identify typical high and low-performance points for each stock and dictate how far back to look for patterns. This setting accurately determines each stock's performance range, offering a comprehensive view of its trends and patterns. We suggest looking into periods of 5 to 10 years to accurately map out the metrics' highs and lows.
- Horizontal Channel— is a setting that helps track metrics that usually move steadily over time. It's excellent for seeing stable trends without big jumps. However, if a metric or stock tends to have significant fluctuations, turning off this setting could give a clearer view of those ups and downs, helping you understand the performance better. Consider checking this setting for metrics that typically vary within a fixed range, like P/S or P/E ratios. See the figure below for the difference when it's on/off.
Horizontal Channel OFF:

Horizontal Channel ON:

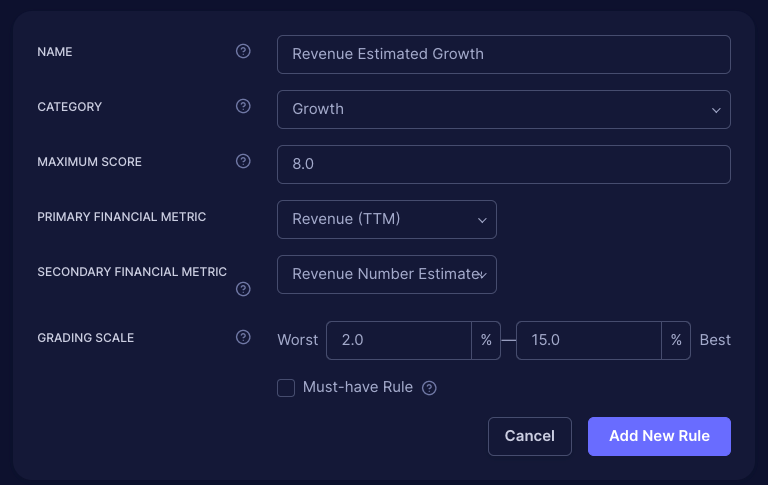
Metrics Comparison
This rule lets you compare two different financial metrics instead of using a fixed range. Use Primary and Secondary fields to choose the metrics you want to compare.
Based on the figure below, the company scores zero if revenue estimates for the next 12 months are at least 2% higher than the current revenue TTM. The company earns the maximum points if the estimates are 15% higher.
Scores are allocated between these two extremes based on how the metrics compare, allowing for a nuanced evaluation of company performance beyond high or low values.
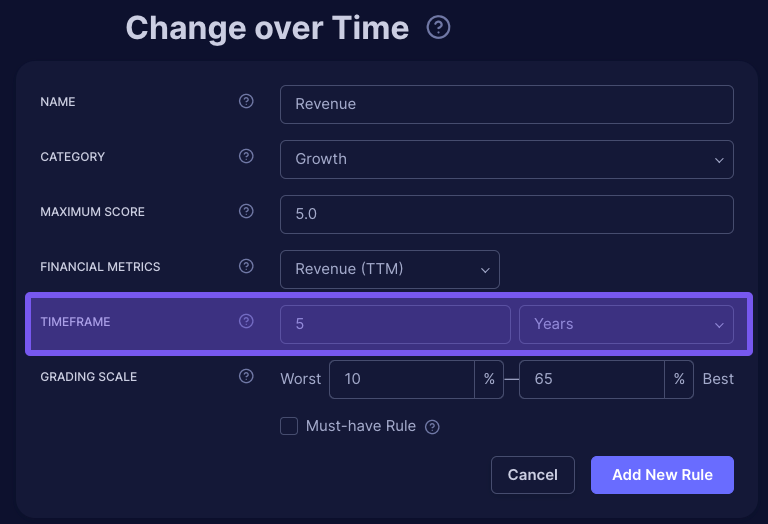
Change Over Time
This setting evaluates a company's performance by measuring percentage changes in a specific metric over time, indicating its increase or decrease.
The unique setting is the timeframe you want to analyze. You can select days, years, or values. For example, if we look at the figure below to see if a company's revenue increased by at least 10% over five years, you define this period at the start.
Companies that don't achieve this 10% growth score zero points, while those that grow by 65% or more get the highest points. There's a sliding scale for growth rates between these extremes, rewarding companies based on their growth.
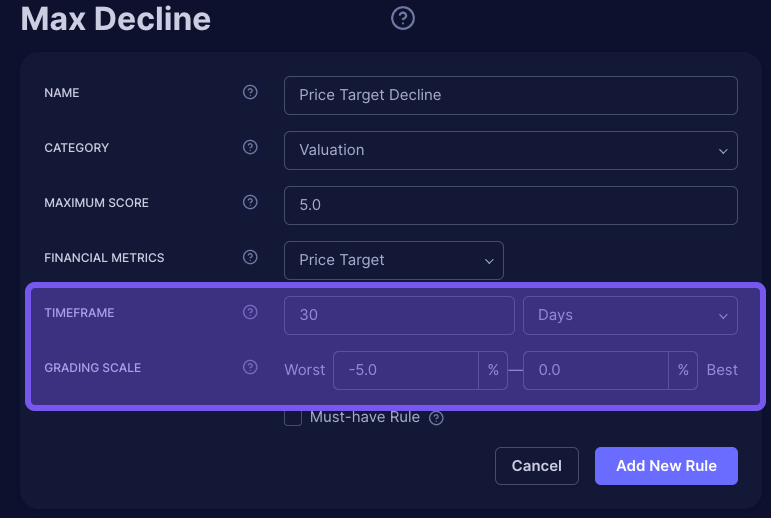
Max Decline
This unique setting for this rule type focuses on tracking declines from a metric's highest recorded value. Here, the decline's starting point is the metric's last peak rather than a fixed time.
When setting up metrics to track declines, it's important to note that the system looks at the highest value reached in the past as the starting point. If a metric doesn't decrease at all, it's considered the best scenario, so anything better than a 0% decline is not applicable here.
The setup is straightforward: specify the timeframe and mark how significant a drop must be to be considered notable.
This rule type is convenient for keeping an eye on essential figures like earnings predictions (EPS) or price targets, helping you stay informed about downward trends.
If you'd like to know more about how Rule Types, read Scrab’s Different Rule Types