

The Model Portfolio feature offers a simulation to track how your current investments might have fared over time. This feature is ideal for benchmark comparisons or exploring variations within your portfolio by adjusting the mix or weight of stocks and ETFs.
It supports testing various portfolio sizes, from a single investment to a diverse collection. It comprehensively analyzes different investment strategies and their potential real-world outcomes. You can refine your investment approach by seeing how your selections could perform under historical market conditions.
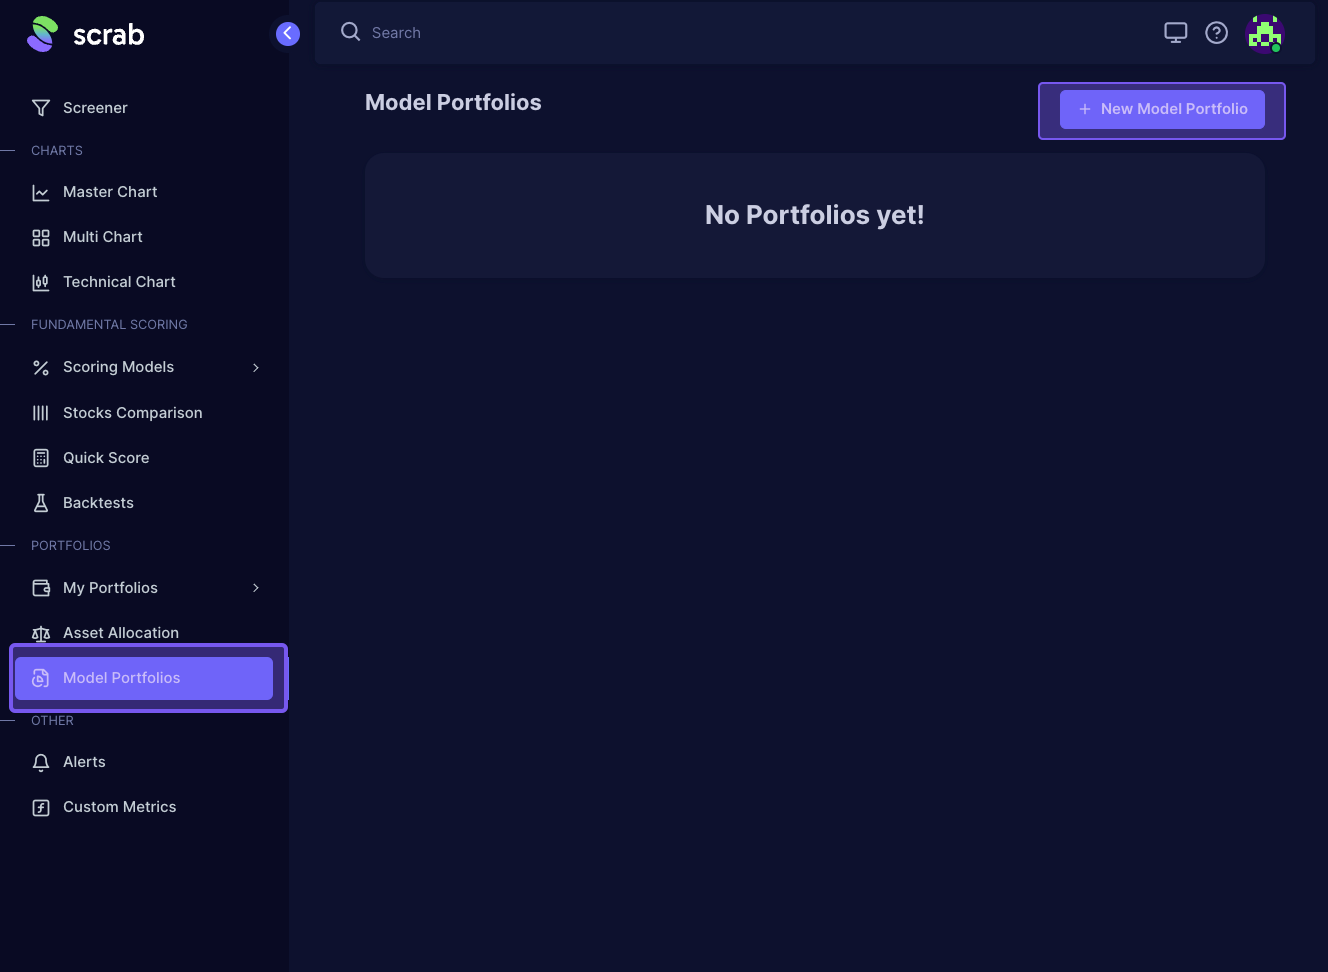
To create and fill out a new model portfolio, go to the left navigation pane and click 'Model Portfolios' under the Portfolios category. Then, click + New Model Portfolio' to go to the settings to tailor your model portfolio.
Next...
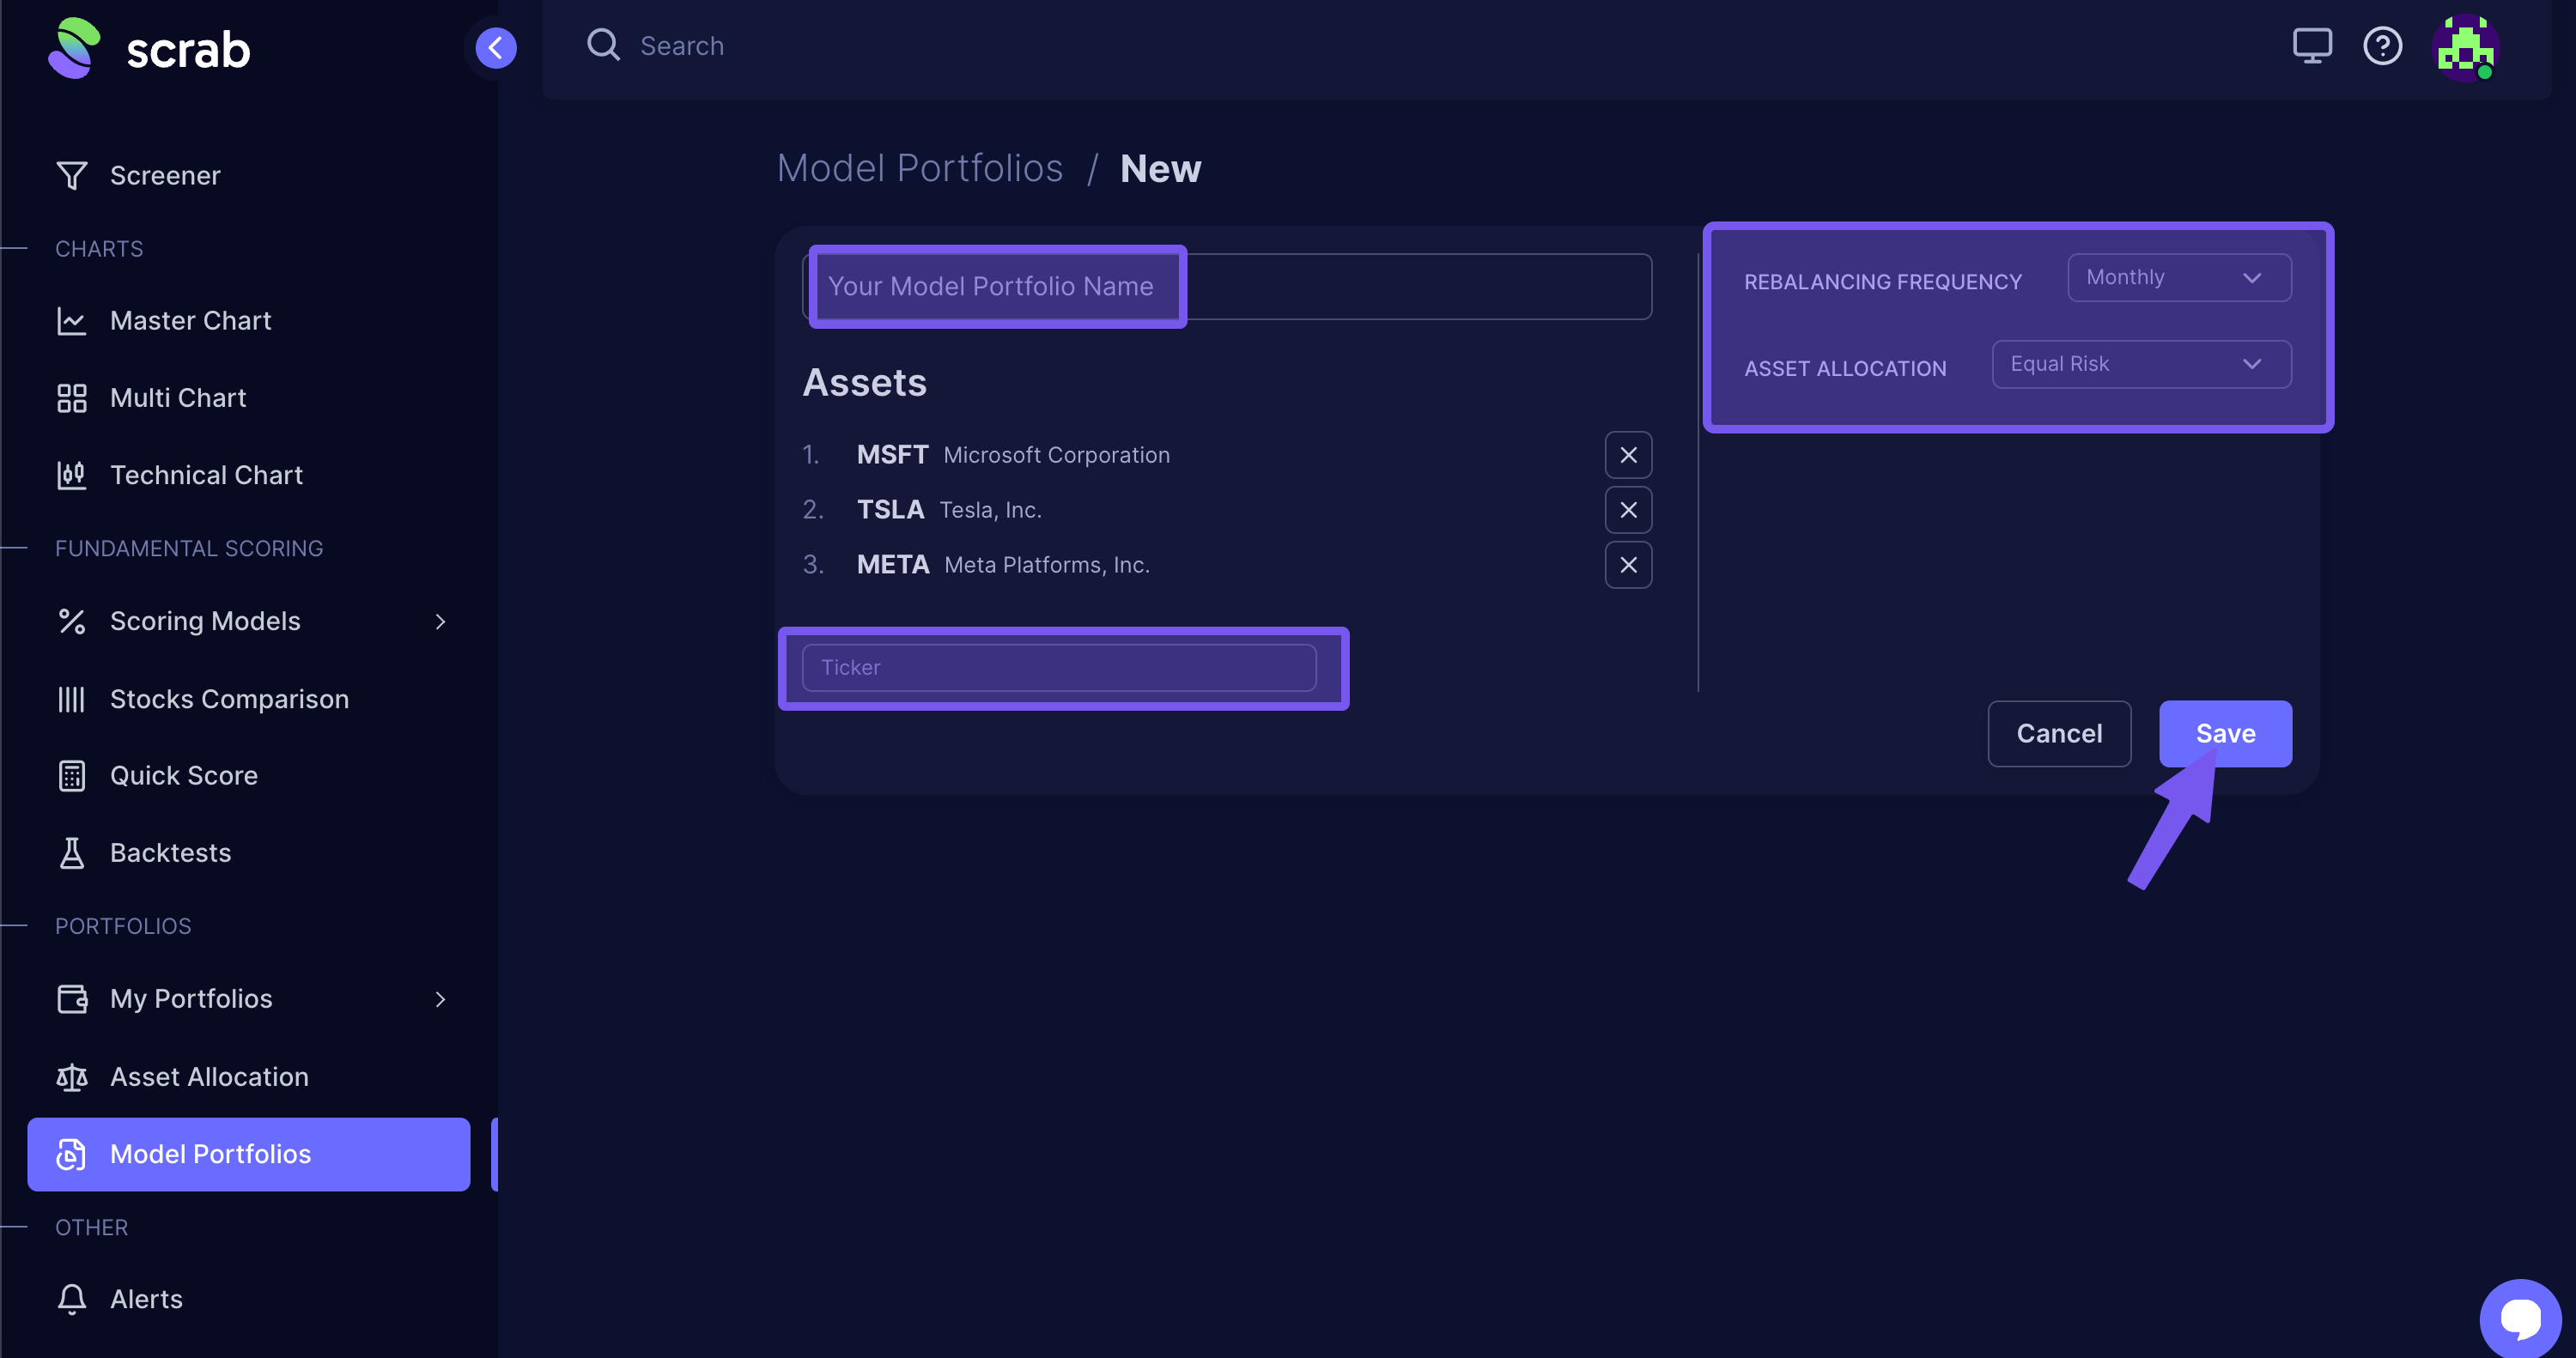
- Name your model portfolio - name it whatever will help you understand what you've backtested.
- Add the tickers of stocks and/or ETFs you'd like to include (separate each with a comma). As you add the ticker/company, an Assets list will display.
- Choosing the rebalancing frequency- Annually, semi-annually, quarterly, monthly, or no rebalancing.
- Rebalancing is how often your portfolio adjusts to ensure each stock's share aligns with your intended weighting strategy. Market changes cause stock values to fluctuate, skewing your portfolio away from its initial setup. Regularly updating your portfolio, such as every month, helps maintain your strategic distribution, correcting any imbalances caused by market movements. This process keeps your investment approach consistent over time.
- Asset allocation weights-Equal weights, Target weights, Proportional to metric, Equal risk, Hierarchical Risk Parity.
- Allocations let you decide the percentage of each stock in your portfolio, giving you control over how much you invest in each one compared to the rest. You can opt for an even distribution to adjust weights based on each company's perceived risk or set specific fixed weights yourself. Typically, keeping weights equal is straightforward and ensures your results focus more on the effectiveness of your stock choices rather than the impact of the weighting strategy itself unless you're specifically examining how different weightings affect your outcomes.
After you've adjusted the settings to your liking, click 'Save.'
Addtional uses for Model Portfolios.
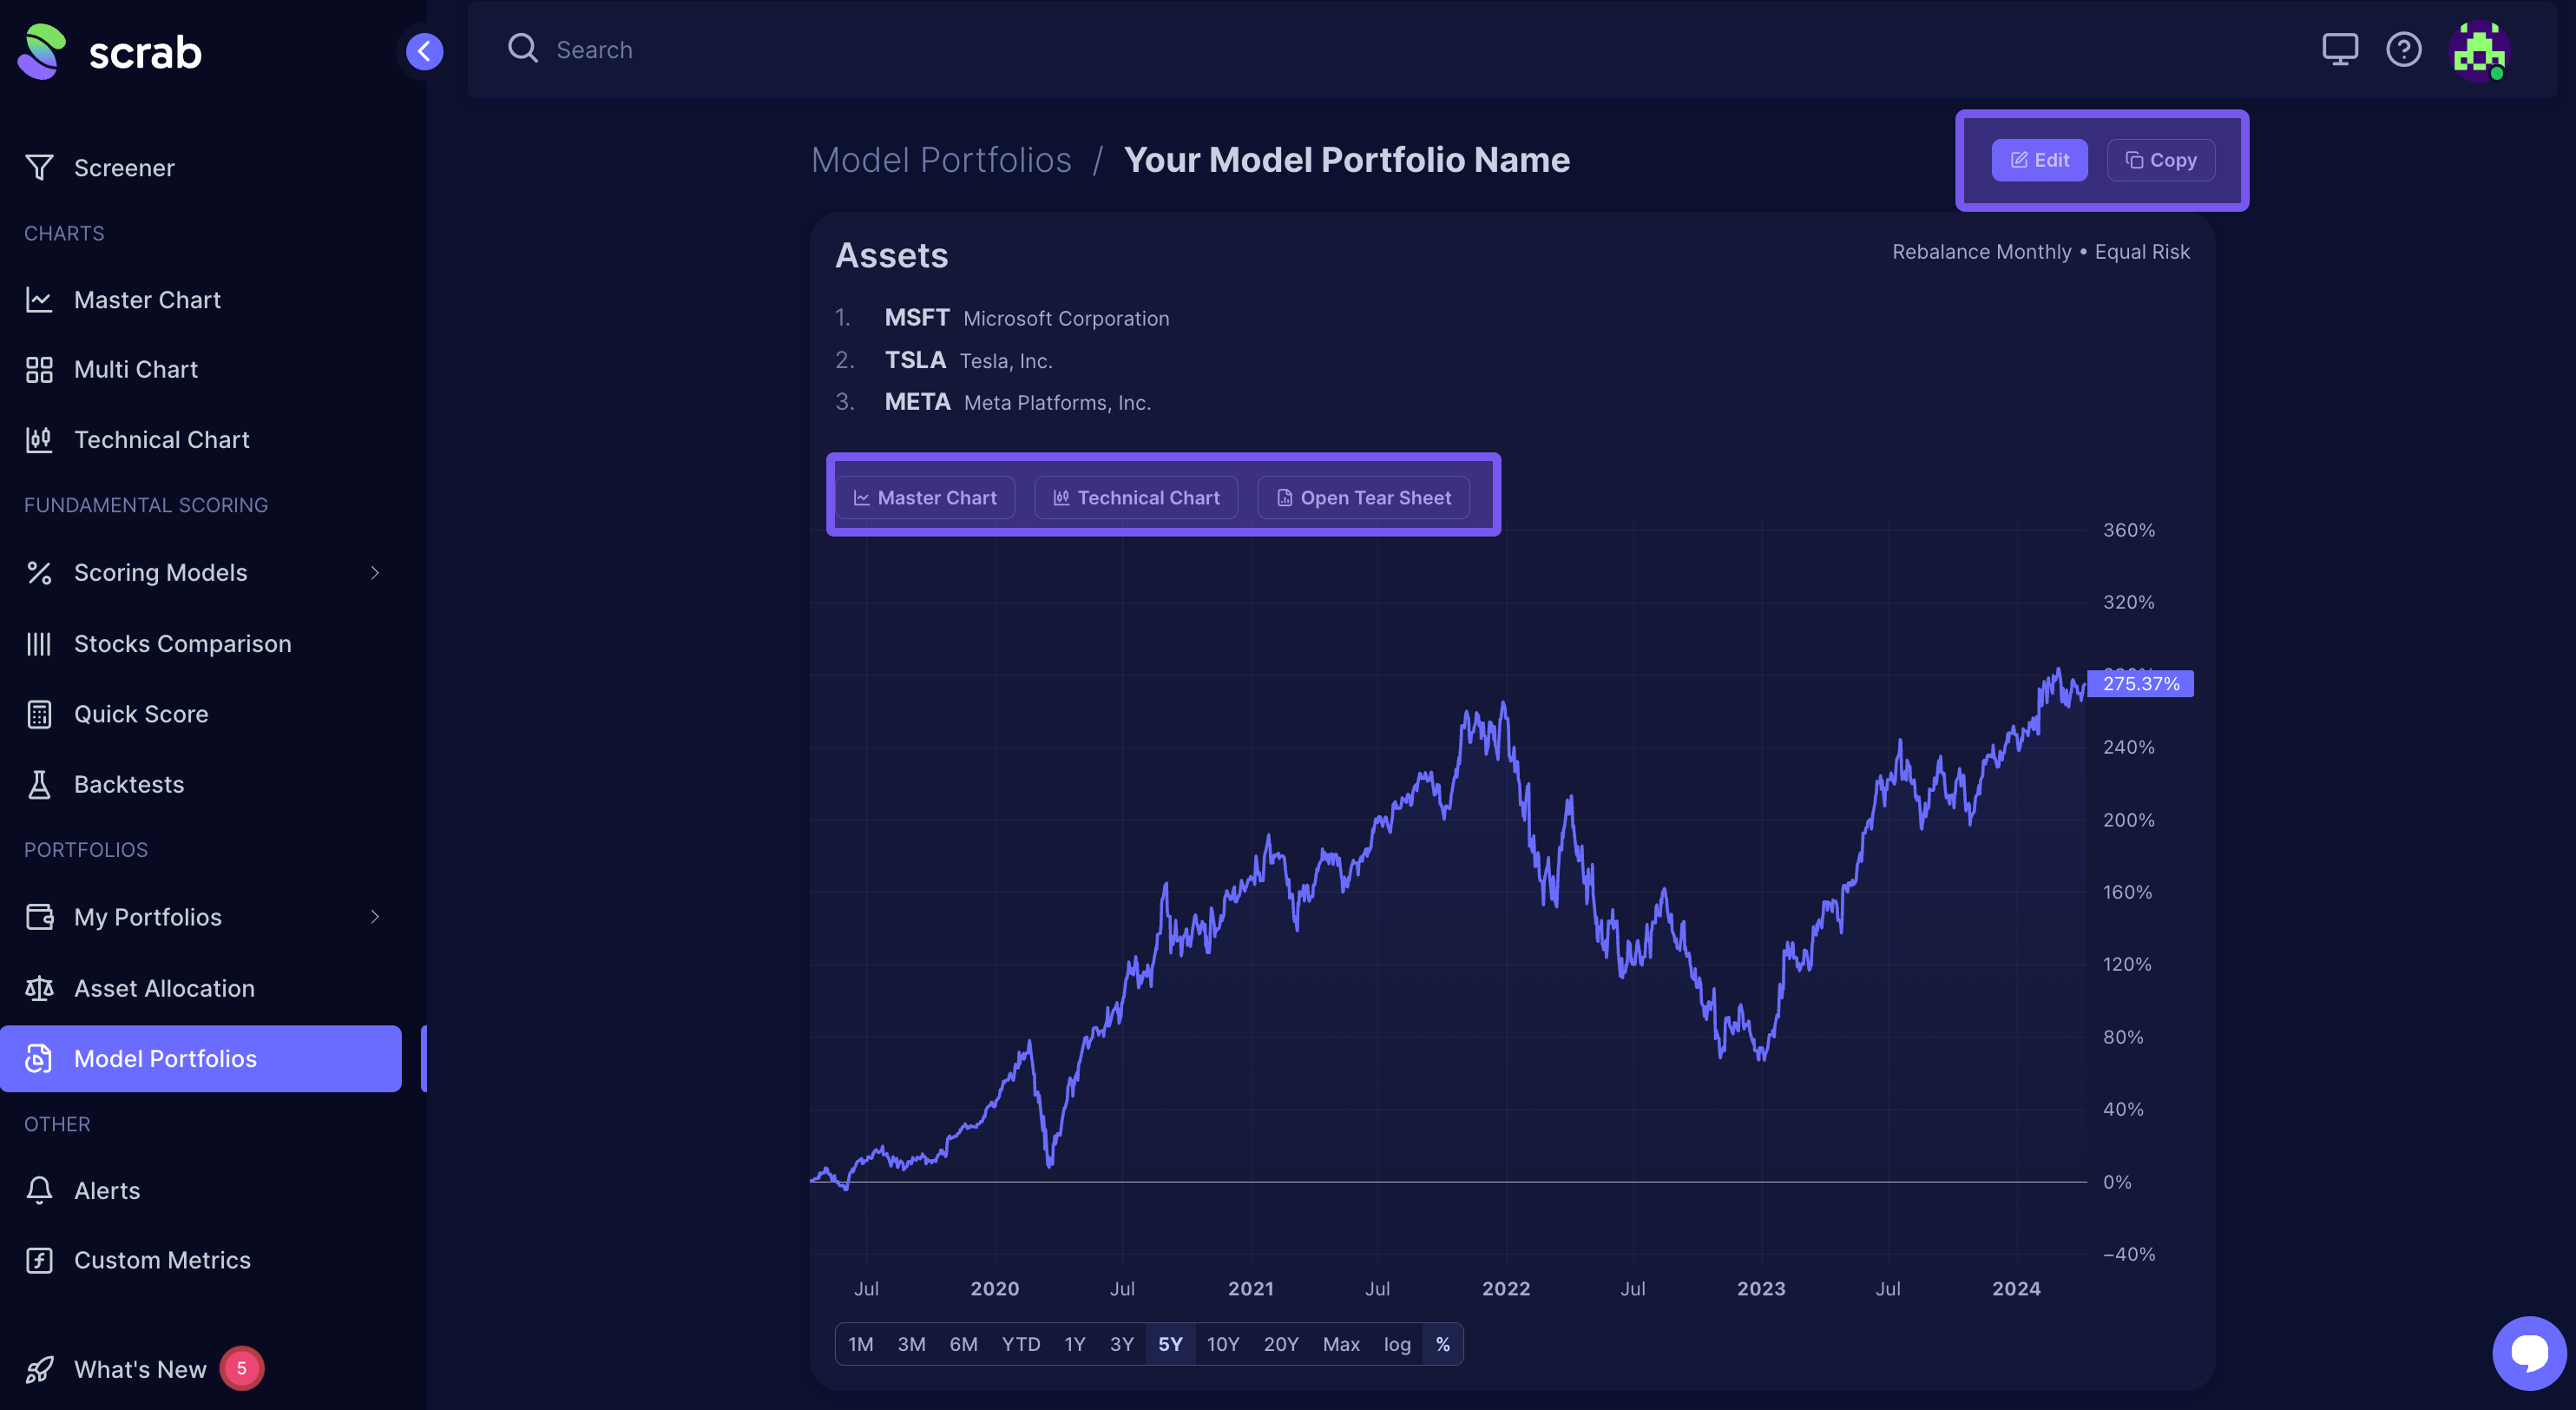
- Use the Master Chart button to compare it with other assets or portfolios during different periods.
- Leverage Technical Charts to conduct a technical analysis of that portfolio.
- Open Tear Sheet to see the details of your portfolio's behavior (annual, monthly, and total return; drawdowns and volatility; Sharp, Calmar, and Sortino ratios, etc.)
- You can also use the 'Edit' button to adjust the original settings.
- If you'd like to run another Model Portfolio for the same companies and adjust the Rebalancing or Asset Frequency, you can simply copy and then adjust those settings.
One more thing...
Before diving into Model Portfolio backtests, it's crucial to understand their limits. For a comprehensive guide, please see: How Backtests Work?