The Screener is a great way to find stocks you may not normally consider.
To get to the Screener, open the left navigation panel and click the first button that says 'Screener' at the top of the navigation list. Once opened, you will see the screener criteria fields. You can use as many or as few criteria as you want in our Screener.
If you need inspiration, click the drop-down menu on the cloud icon in the upper right corner and choose our Predefined Screener Criteria.
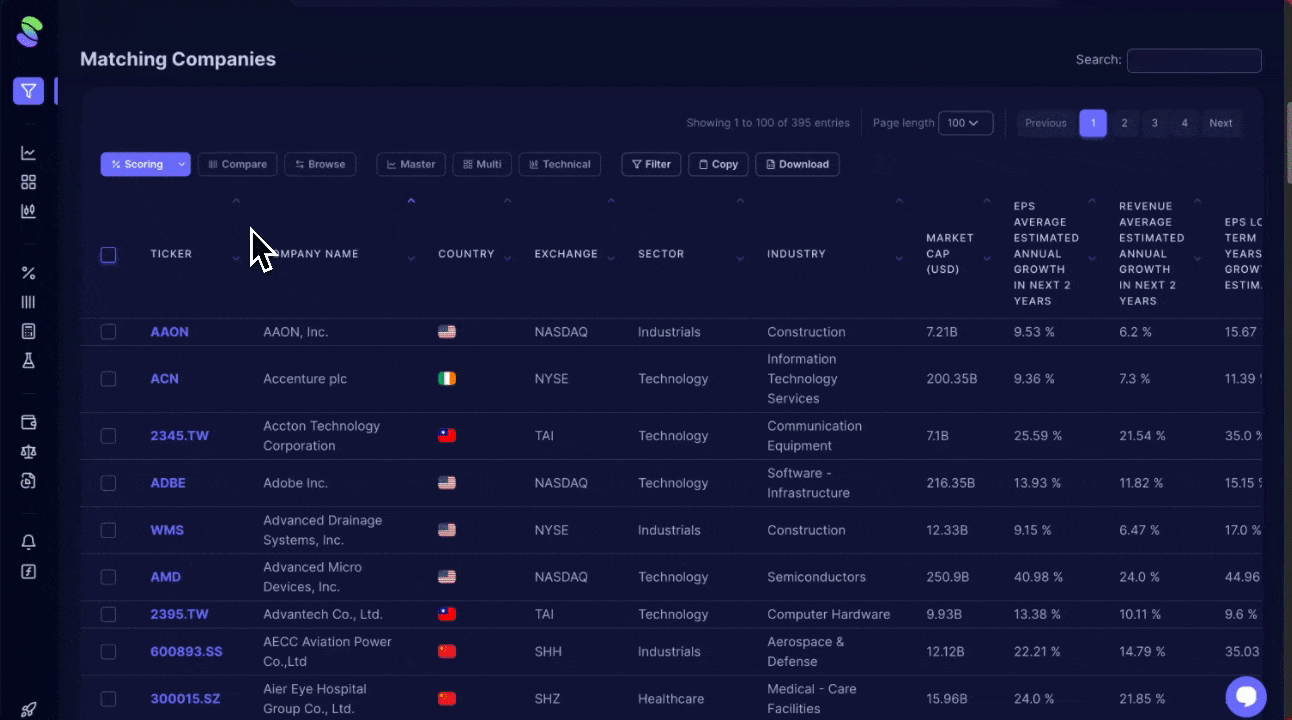
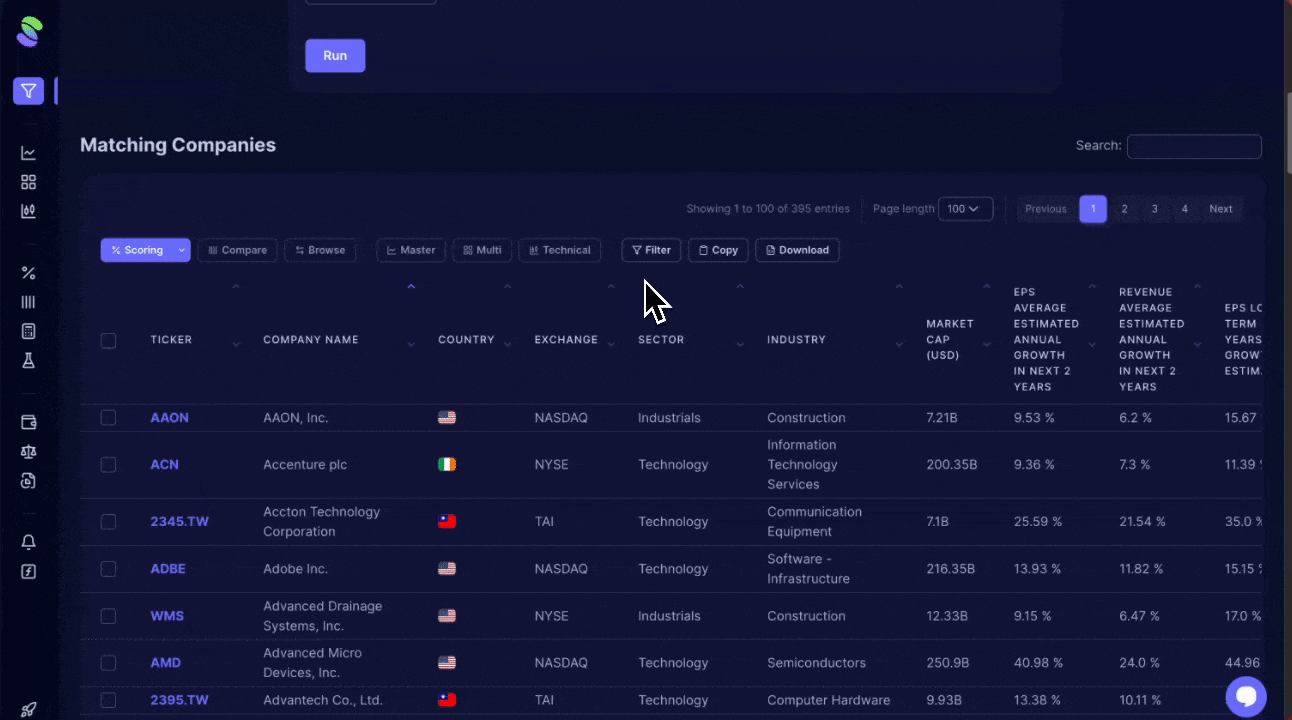
You can also save and name your screener criteria or load any previously saved criteria. Once you've entered the criteria you want the Screener to use, click Run. At the bottom of the page, a list of companies that meet your criteria will appear.
Screener criteria you can use
Company Countries: Leave 'Countries, Sectors, and Industries' blank to search across all markets and sectors, or select exclude to omit them. Specifying these filters narrows your search to selected areas.
Exchanges: Include or omit specific market exchanges.
Sectors: If you're interested in one or a few sectors, you can filter for them or exclude them. Examples of sectors include Technology, Financial Services, and Healthcare.
Industries: Filter for particular industries where you may want to run your Screener. These include Construction, Consumer Electronics, and Steel.
Market Capitalization: To filter companies, specify a minimum or maximum market cap. Typing "b" for billions and "m" for millions helps refine the search to companies of a specific size, though smaller companies might have less data available.
Historical Data: This is optional, but you can choose from the calendar setting to run the screen for a specific month.

Additional Criteria
Scrab also provides additional criteria categories to customize your Screener run even more. Click the + Add Criteria button and click through each category in the Screener to review all available metric criteria.
If you want to select a specific metric, click on it. You will see a small green checkmark. Click X to remove the additional criteria and rerun the Screener.
Popular Metrics: Include Price, EPS, Average estimated annual growth in the next 2 years, PS Ratio, PE ratio, and more.
Cash Flow: Include Cash from Financing, Cash From Investing, Cash from Operations, and more.
Balance Sheet: Total Assets, Book Value, Tangible Book Value, and Inventory.
Income Statement: Revenue, Revenue per Share, EPD Diluted, EPS Basic, EBIT.
Dividends: Dividend Yield, Dividend Payout Ratio.
Technical Indicators: 20, 50, and 200-day simple Moving Average, Exponential Moving Average, and Relative Strength Index.
Price & Market Data: Price, All-time High, 1 Day Returns, Market Cap, Volume.
Valuation: PS Ratio, PE Ratio, PEG Ratio, EV to EBITDA, Price to Book Value.
Margins & Efficiency: Gross Profit Margin, Operation Margin, Profit Margin, Return on Assets.
Liquidity & Solvency: Debt to Assets, CFO to DEBT, Quick Ratio, Current Ratio.
Estimates & Recommendations: Price Target Upside, Annual Actual Revenue, Annual Actual EPS.
Risk: Historical Sortino, Daily Value at Risk, Historical Monthly Expected Shortfall.

Screener Results and Additional Functions
Note that if no companies match your screener criteria, you will see a message listing no matches found. If this happens, adjust your criteria settings.
Now that you have run the Screener and have a few companies for results, uncollapse each to learn more below!
Scoring
Scoring
You can add all or a select few to one of your scoring models (to select multiple companies, single-click on as many individual company lines as you want).
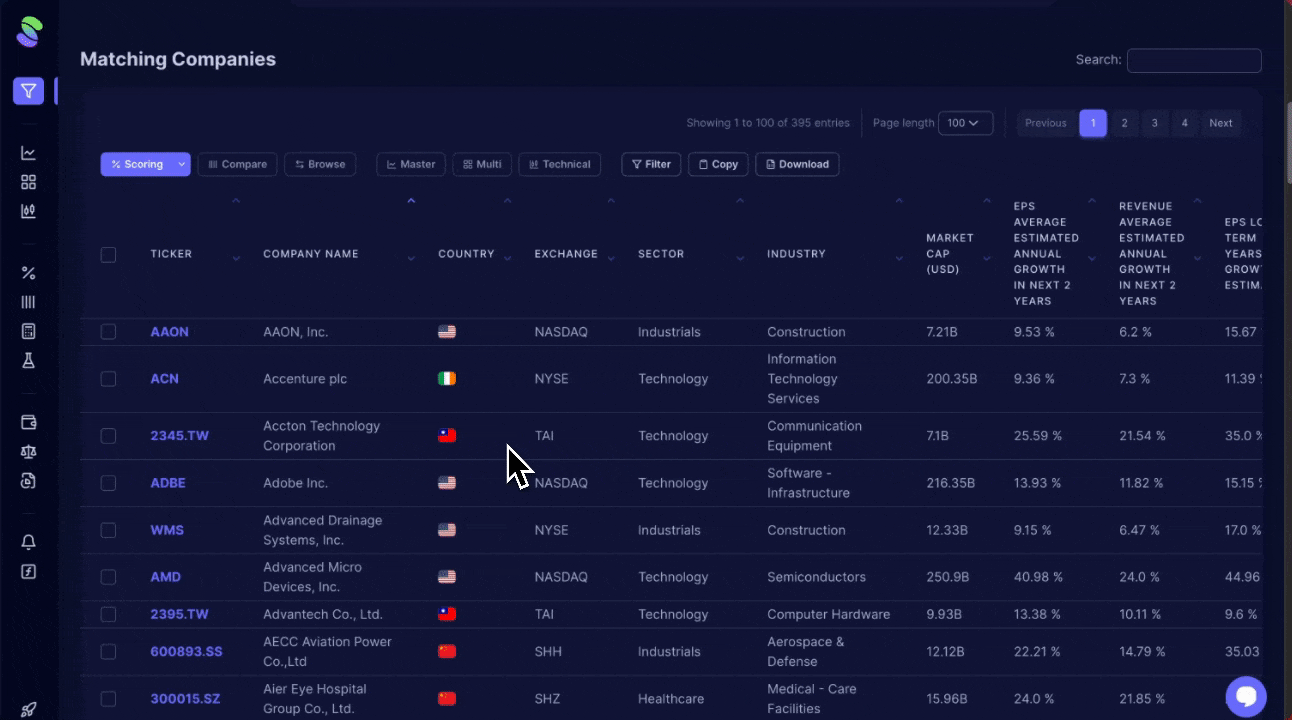
Compare Stocks
Compare Stocks
Using the Compare function is helpful if you find two or more interesting stocks but are unsure which ones would benefit you.
You can select the companies you'd like to compare and then click the compare button. This will take you to a new screen displaying each stock side-by-side.
Browse Company Details
Browse Company Details
To view more details/information about any company provided in your screener results, check those you'd like to review and click the Browse button.
You can use the toggle buttons at the top and middle to navigate each company's detail page.
View Master, Multi, and Technical charts
View Master, Multi, and Technical charts
Use these functions to visualize any company metrics better to find patterns or trends.
Select the companies you want to view and then click the chart type you want to view.
Additional Filters
Additional Filters
Scrab provides additional filters to help you narrow down your screener results. By using Scrab's sorting and filtering tools, you can simplify your results by narrowing your focus to top performers.
For instance, you can sort companies by debt-to-assets ratio to find the lowest or use the filter tool to set multiple conditions, like combining debt-to-assets less than 30% with a Current Ratio over 1.5. This effectively narrows down your list.
Additionally, you can customize filters with logical operators like AND/OR to handle complex criteria, allowing you to manage lists from broad or specific angles based on your investment strategy.
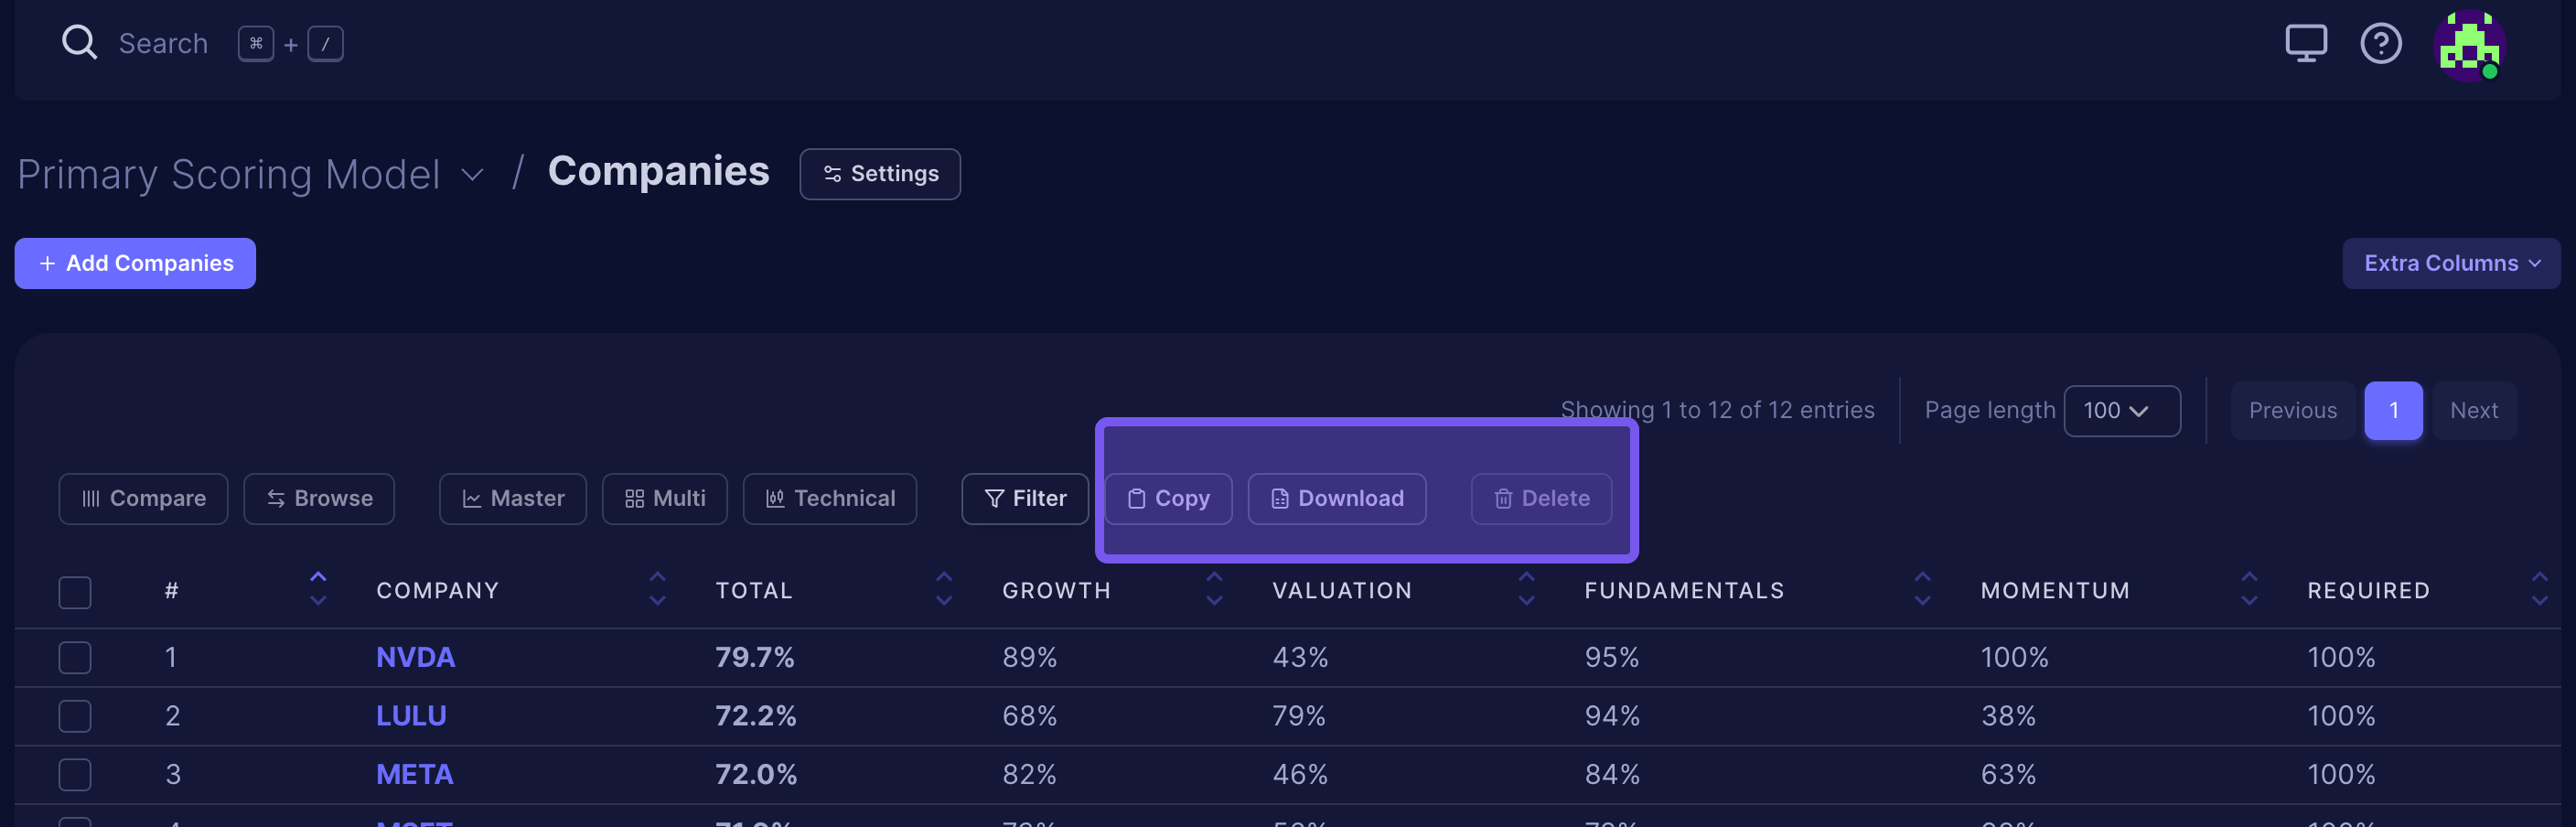
Copy, Download, or Delete Results
Copy, Download, or Delete Results
You can copy the selected companies to your clipboard or download them as an Excel File if needed.
If you decide to delete a company from the scoring model, click the Delete button.